Internet Topology (experimental)
Experimental
A view over what the path meter already records: no new
probes, nothing in the alert path, and it may change or go away without
a deprecation period. Pro with InfluxDB, and only with the path meter
on (smoking-pi enable pathmeter).
The measurements say how fast each destination answers. The path meter says which way the packets went to each one, an hour at a time. This dashboard puts the destinations side by side to answer two questions a home user can act on: how does this house reach the Internet, and which networks do the destinations it measures have in common. It is not a network operations tool: a route that changes is a fact to read, not something to be paged about.
Open Internet Topology (experimental) in the Grafana folder Advanced, or from the SmokePing dashboards dropdown. Its default range is the last 7 days; routes change over days, not minutes.
Only the hourly traces count. The extra traces the path meter takes during
a loss episode (tagged trigger=episode)
are left out, so an evening of loss does not weigh more than any other
hour, and every destination contributes one trace per cycle.
Filters
- Destinations: the destinations the path meter traced in the range, by
base name (
Google, notGoogle_h2). All by default. - AS: keep only the destinations whose recorded path crossed this network (autonomous system, by number) at any hop in the range.
- Path evolution of: the one destination the last row follows. A click on a destination in the tables above picks it.
- The time range: every panel reads the range picked.
AS Map
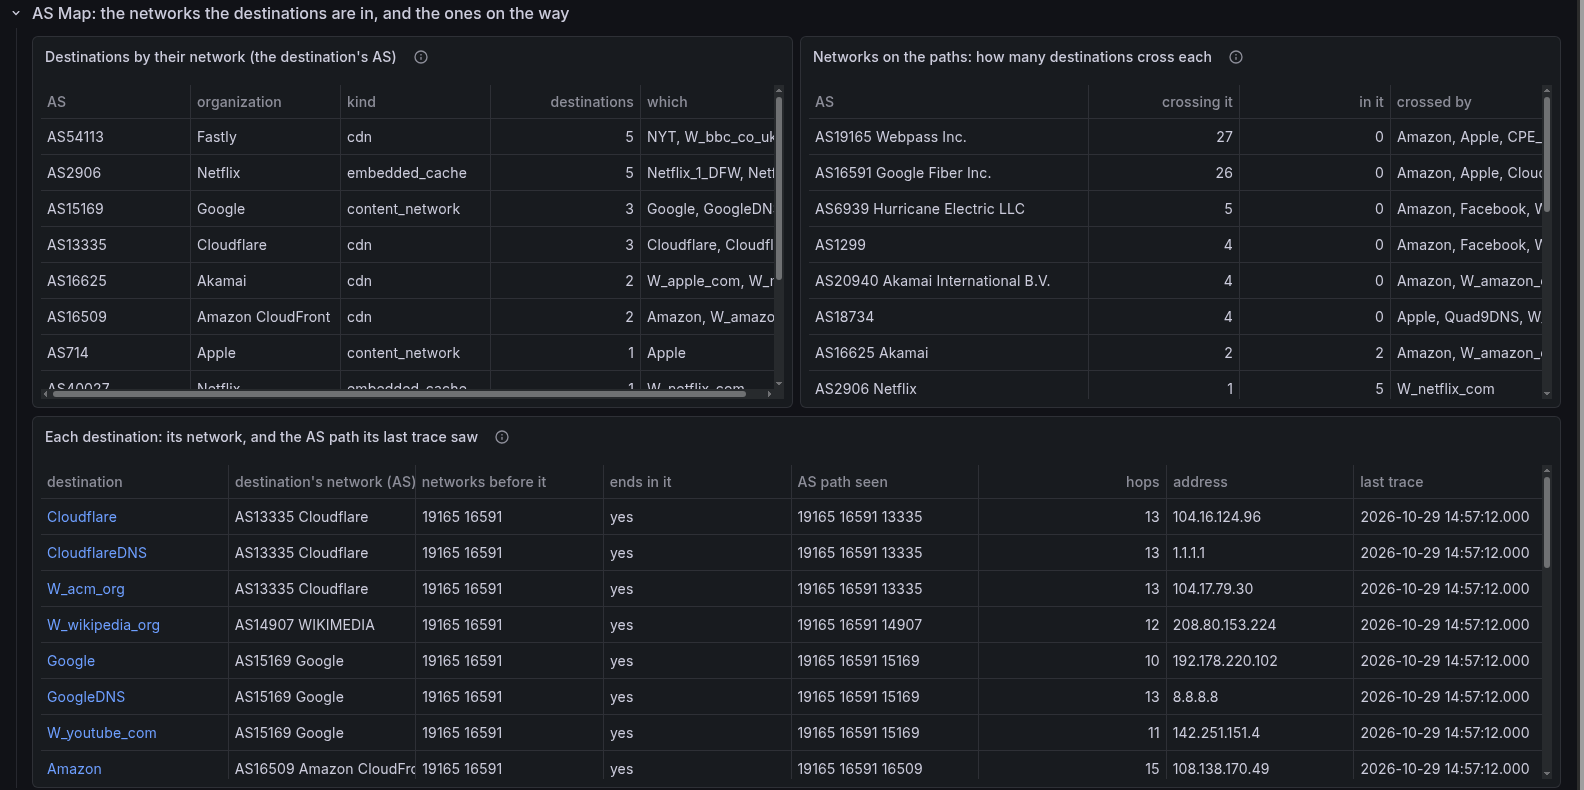
- Destinations by their network: every destination measured in the range, grouped by the network its host's address is in (from the same labels as Targets by service). Destinations in one row share a network: on the reference house, six Netflix names are all Netflix's own network (embedded caches), five sites are all served by Fastly.
- Networks on the paths: every network a trace crossed, named (see what it cannot say), with how many destinations' paths cross it on the way and how many are in it. The house's provider is first (every path crosses it); the transit networks after it are the infrastructure some destinations share and others do not.
- Each destination: its own network next to the AS path its last trace
saw, with the destination's network taken off the end (networks before
it). Ends in it says whether the trace's last answering network is the
destination's:
nois a CDN address announced by the network that hosts it, an exchange point, or two lookups disagreeing;not reacheda destination that did not answer the trace.
The destination's network and the networks on the way are kept in separate columns on purpose: the first says who answers, the second who carries the traffic there, and they are different questions.
AS dispersion by hop
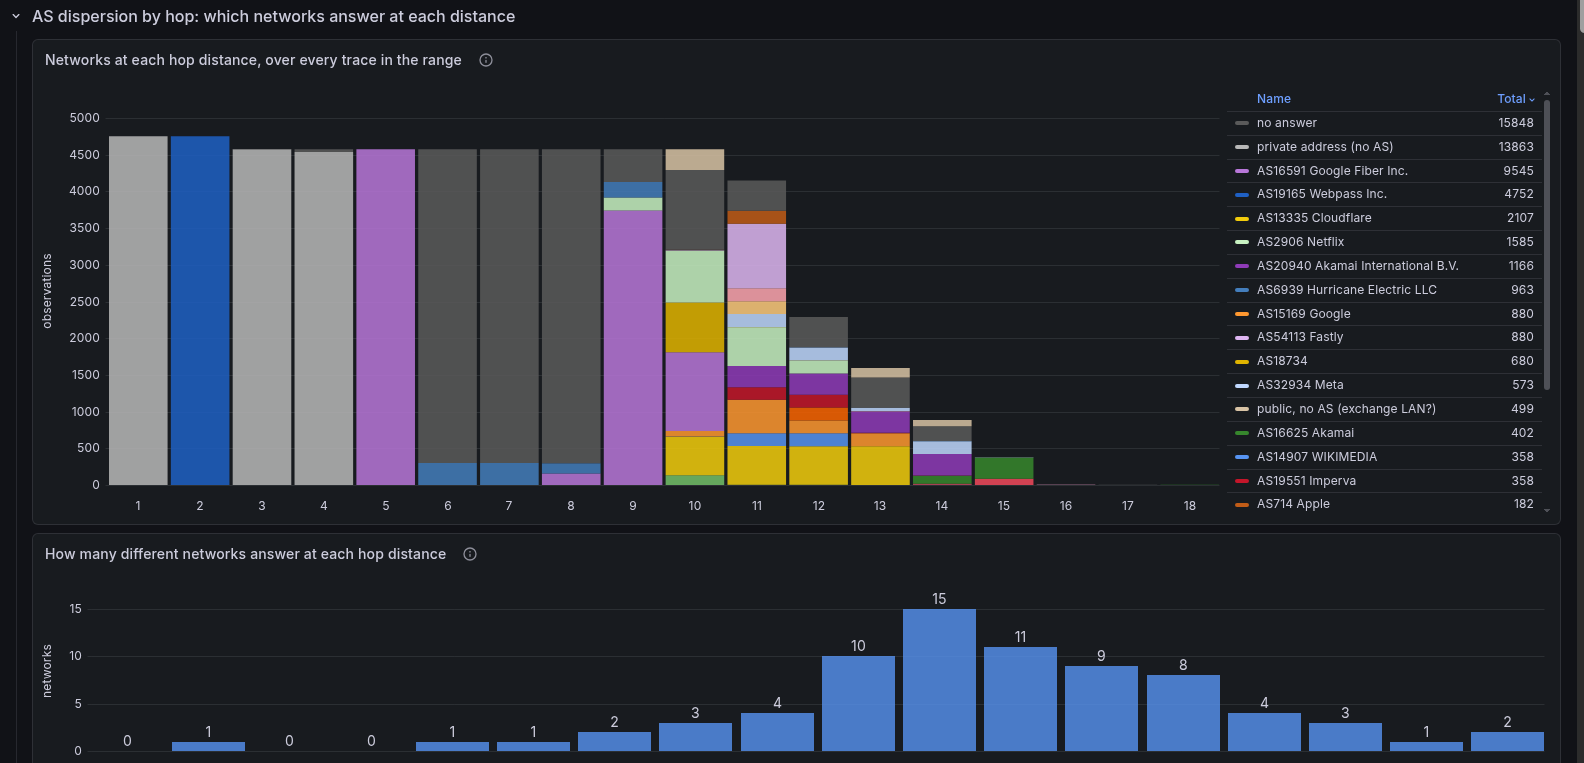
Each bar is one distance from the house (hop 1 is the home router), and its segments count how many times, over every trace in the range, that hop answered from each network. It is the spread of many observations, not one traceroute. Read it from the left:
- one color filling a bar is a stretch every path shares (the home router, the provider);
- several colors stacked are where the paths part, toward different transit networks and, at the end, the destinations' own;
- no answer (dark gray) is a hop inside a trace's length that did not reply: many routers do not answer traceroute, or rate-limit it. On the reference house, hops 6 to 8 almost never answer;
- private address (light gray) is a hop that answered from an address
no network announces (the home router, the provider's internal
10.xrouters); - public, no AS (beige) answered from a public address no network announces, most often an exchange point's LAN.
Each network is named in the legend as in the tables (see what it cannot say). Bars get shorter to the right as destinations are reached. The second chart counts how many different networks answered at each distance: one is a shared stretch, more is where the destinations' paths part.
A destination traced past the shared first hops (see the path meter) counts those hops with the addresses its latest full trace learned, so every destination contributes one observation per hop per cycle.
Path evolution
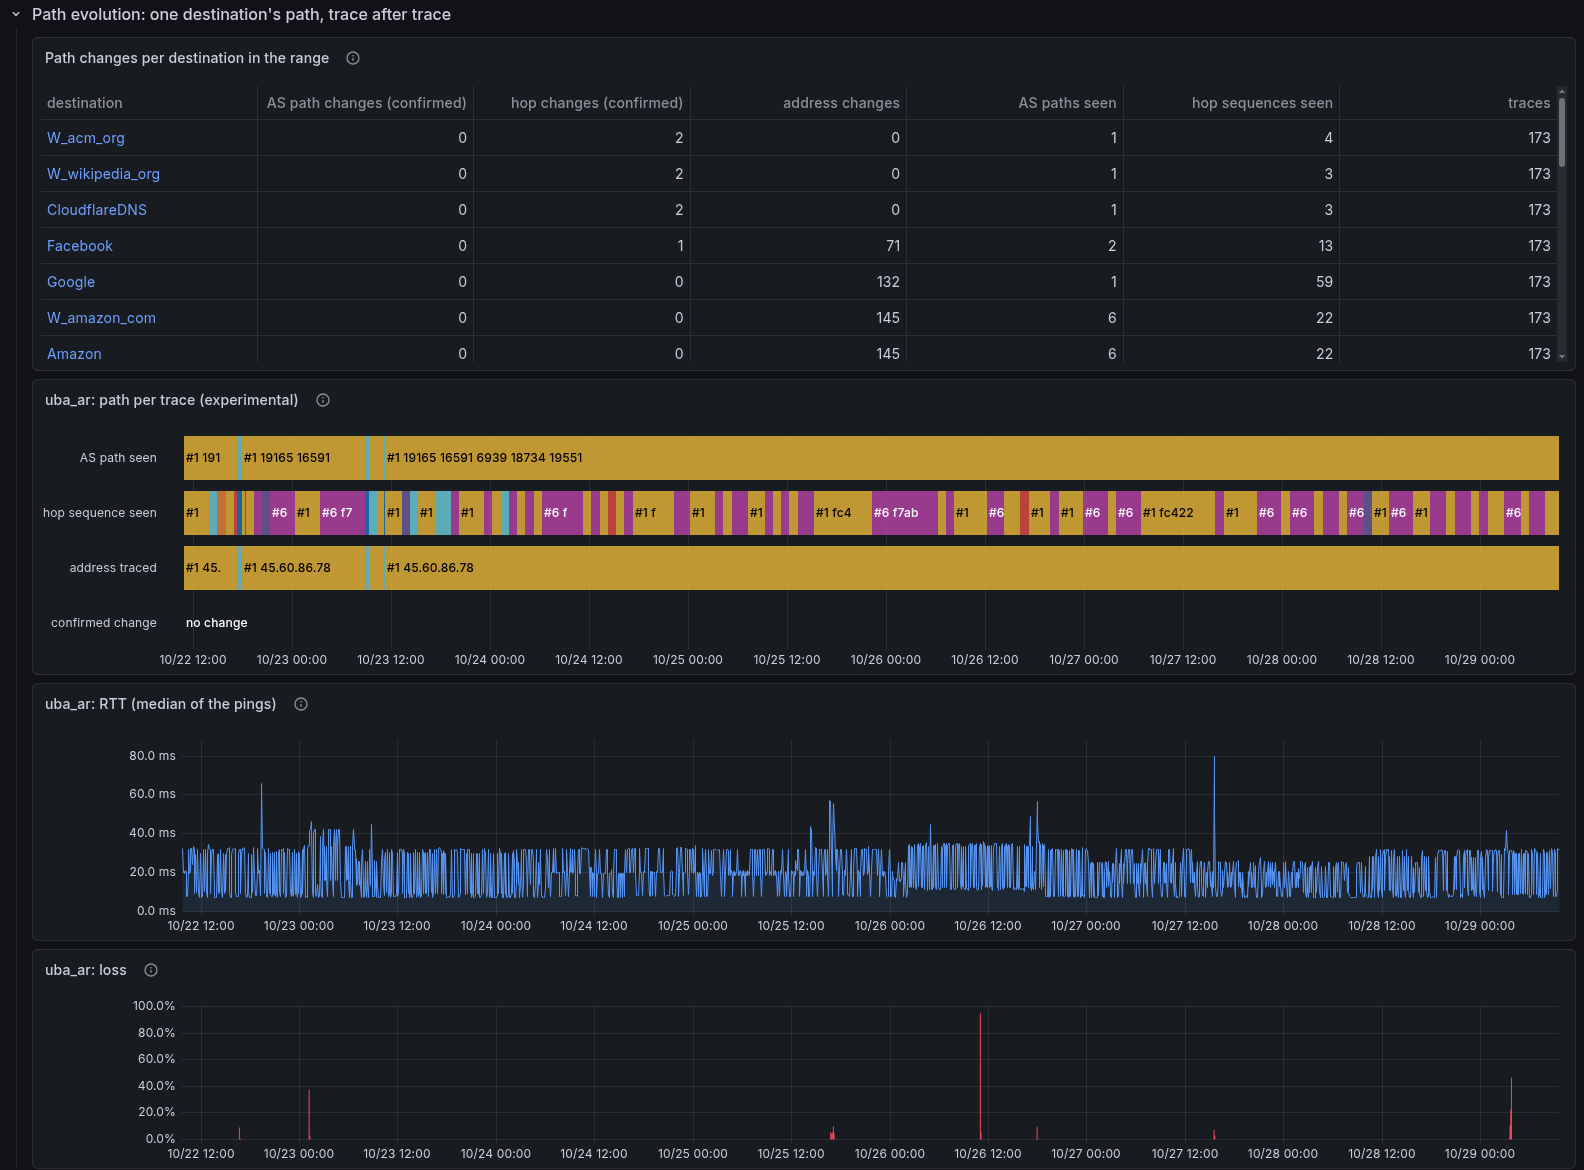
- Path changes per destination: the confirmed columns count only what two traces in a row agreed on (as the path meter decides a change). AS paths seen and hop sequences seen count what single traces saw, confirmed or not: more sequences than confirmed changes is usually a load balancer, or a router answering from another of its addresses, not a new route. A destination behind a name that resolves to many addresses (Google, Amazon) changes address almost every hour; that is DNS, not the route.
- Path per trace: one bar per trace for the destination picked. The AS
path, the hop sequence (a short hash of the hop addresses) and the address
traced are numbered in the order they first appeared (
#1,#2…), each keeping its color; the last row marks only the confirmed changes. - RTT and loss of the same destination's ICMP probe, on the same time axis, with the Path changed (experimental) annotation. A latency step that lines up with a confirmed change is worth reading together; one that does not happened on a path the traces did not see change.
What it cannot say
- A hop's network is an inference. It is the network that announces the address's prefix in BGP (CAIDA's RouteViews table), or the member that uses an exchange point's port (where the networks come from). A router can answer from an address another network owns (its interface on a link numbered by its neighbor), and a tunnel (MPLS) can hide hops entirely. Neither the AS path nor the counts are proof of which networks forwarded the traffic.
- One vantage point, one direction. The traces go from this house to each destination, one flow each (Paris traceroute over ICMP). The way back, the other equal-cost paths a load balancer spreads traffic over, and the networks these traces never cross are not seen. The dashboard shows the house's view of the Internet, not the Internet's topology.
- Who networks are, not how they relate. Two destinations behind the same transit network share that network; nothing here says anything about the business relationships between networks.
- A network's name is a registry's. A network that is some
destination's own shows its operator from the targets' labels (
Google); any other shows the organization CAIDA's AS2Org file gives for its number (AS6939 Hurricane Electric LLC), as the path meter recorded it with the hop. Hops traced before the path meter recorded names (v2.49.0 and earlier) show the number alone. An organization's registered name is not always the brand people know. - A silent hop is the router's choice. A hop that does not answer, or answers slowly, says nothing about the traffic going through it.
In InfluxDB
The dashboard writes nothing. It reads path_trace and path_hop from the
path meter (In InfluxDB), including each hop's
as_name, and target_labels from the exporter (service
taxonomy).