SmokePing MCP Server
An MCP server that makes the Pi's SmokePing stack AI-operable. It wraps two backends:
- the config-manager REST API (target CRUD, config generation, SmokePing restart, service status)
- InfluxDB 2.x (latency / loss / microcut time series)
Source: shared/modules/mcp-server/.
Any MCP client can use it: an assistant on the Pi with the local token
(sudo smoking-pi connect openclaw), or one anywhere else through a tunnel,
signed in with a pairing code and limited to the read tools
(sudo smoking-pi connect NAME) — see
remote-connector.md. The tools that change something
(add_target, remove_target, toggle_target, apply_config,
mute_alerts, unmute_alerts, ack_incident, and get_chart's
deliver=true) answer read-only to a remote assistant.
Tools
| Tool | What it does |
|---|---|
list_targets(service_category) |
All monitoring targets with category, host, active state, and what each one is: its service and service categories (taxonomy.md); service_category keeps only the targets in that category |
add_target(name, host, category, title, probe) |
Add a host to monitoring (validates name/category, resolves probe) |
remove_target(name) |
Delete a target by name |
toggle_target(name) |
Pause/resume monitoring for a target |
apply_config() |
Regenerate SmokePing config + restart the service |
system_status() |
Health of config-manager, database, SmokePing container; a wifi block (SSID, signal, bitrate, uplink_is_wifi) when the host is on Wi-Fi; an uplink block (the interface every measurement crosses, its kind, and its last_change within a week) when host_uplink has data |
get_latency_stats(target, hours) |
Median/p95 latency (ms) and mean loss % per target: ICMP, DNS, HTTP (a HEAD request: connect, TLS, response headers) and TCP connect. An unknown target returns an error with the real names and a did_you_mean |
diagnose_loss(hours) |
Every loss episode in the window (at most 168 h) classified: probe_miss (one point on one target), local_wifi (this host's own Wi-Fi: deaf radio, lost association, carrier, weak signal), local_link (the line to the ISP: total loss while the host still heard its network, first-hop cuts with several destinations, a first hop whose loss rose with everything else's, a standalone microcut), monitor (every named site lost while the gateway and the resolvers answered by address: this host's own DNS), destination (one or two sites, peers fine; dns/ipv6), upstream (most destinations with a normal first hop, a low-grade loss on most paths, or every destination lost while the gateway answered), unclear. Each with confidence (high/medium/low), evidence and against sentences with the numbers, a summary, and a graph link; coverage says whether Wi-Fi, first-hop and TCP/HTTP evidence existed and whether breadth-only voters were counted (breadth_only). The "N of M destinations" counts and targets_reporting include the HTTP, TCP and DNS wizard targets that vote on breadth, as the alerter counts them; targets names only the ICMP and resolver targets — see detection-reliability.md |
get_incident_history(days, include_probe_miss) |
Past loss incidents (at most 365 days) as diagnose_loss classified them, from the history the alerter writes once each one is over (loss_incident in InfluxDB; the newest half hour is not there yet). Same fields as diagnose_loss, newest first, at most 100, with by_class over the window; probe_miss left out unless asked. stored_from: null means nothing is stored yet (the alerts service writes it) — see alerting.md |
get_notification_history(days, kind) |
What the alerter told the user, from its notification ledger (at most 30 days): one entry per notification it decided on, newest first, at most 200 — kind (alert, recovery, monitor, pattern, watchdog, outbox_summary, quiet_bundle, weekly, report; digest on entries from before the weekly), rule, targets, the text as sent, outcome (sent, handed to the gateway, queued, held, failed, skipped-duplicate), decided/delivered, message_id, diagnosis, and delivered_in when a later summary carried it; counts by kind/outcome. JSON text, never an image. recorded_from: null means nothing is recorded yet. The web admin's chat answers from the same code (common/notification_ledger.py) — see alerting.md |
get_loss_events(hours, min_loss_pct) |
Packet loss in the window and its shape: widespread runs (most targets — WIDESPREAD_PCT, 80 % — losing at least WIDESPREAD_LOSS_PCT, 30 %, at once: the alerter's rule; with a cause — this host's uplink when every target lost every packet for three cycles or more, a brief cut of the link otherwise), per-target episodes (consecutive points folded into one, with duration), the per-target rollup and the raw points. By default an event is two or more lost pings of however many the target's probe sends (15% on ten, 30% on DNS's five; min_loss_pct sets a fixed percent instead); each target reports its step_s and pings, and the single-ping background is counted in background_points, not listed — see detection-reliability.md. uplink_changes appears only when the host's uplink changed in the window: points on either side crossed different links. The widespread shares, targets_affected, targets_total and targets_reporting count the HTTP, TCP and DNS wizard targets that vote on breadth, as the alerter does, over windows up to 168 h (breadth_only: false: not counted, for any reason — past 168 h, a failed query, or none voting); events, episodes and by_target never list them. The web admin's chat answers from the same code (common/loss_events.py) |
get_microcut_stats(hours) |
CPE microcuts as cuts: runs of 10 s windows above MICROCUT_LOSS_PCT folded into one each with duration, confirmed (two or more windows, or 100%) or possible; per target+protocol the floor (p50_loss_pct / p90_loss_pct), cut_windows, confirmed and possible counts; the five worst cut windows; a note stating the floor when there were no cuts — see detection-reliability.md |
get_wifi_stats(hours, interface) |
The host's own Wi-Fi uplink: current association and signal/bitrate, the window's signal range, weak share, disconnects, roams, failures and peak throughput, worst 5 samples with zoomed links; present: false on a wired host — see wifi.md |
get_chart(target, hours, with_peers, deliver) |
On request only: a PNG of one target's latency (median + spread of individual pings) over its loss — see On-request charts |
mute_alerts(target, rule, hours, reason) |
Stop sending alerts for a target and/or rule for a while (default 2 h, capped at 24; target="*" mutes everything). Incidents are still tracked, counted and shown by list_alert_state |
unmute_alerts(target, rule, all) |
Lift a mute early. Nothing is replayed, so unmuting never produces a burst of catch-up messages |
ack_incident(key, hours) |
Say nothing more about one open episode (episode:<id>: no update, no end message) or keep one signal out of every episode until it ends — narrower than a mute. The key comes from list_alert_state() |
list_alert_state() |
The open episode (cause, confidence, material or the conditions it missed, what was pushed), the episodes of the last day, the active signals and the active mutes: what is wrong, what was said, and what is quiet |
The last four are the alert-control surface, and they exist for one reason:
muting a noisy target should be something you say in the chat where the
alert arrived, not a file you edit on the Pi. They are registered
regardless of the alerts profile — they read and write the alerter's
state files, so with the alerter stopped a mute is recorded and takes
effect the moment it starts. The semantics, and the ways muting can cost
you an outage, are in
Muting alerts without losing them.
Environment variables
| Variable | Default | Purpose |
|---|---|---|
CONFIG_API_URL |
http://config-manager:5000 |
config-manager base URL (http://localhost:5000 from the host) |
CONFIG_API_TOKEN |
(unset) | If set, sent as Authorization: Bearer <token> on every API request |
INFLUX_URL |
http://influxdb:8086 |
InfluxDB 2.x URL (http://localhost:8086 from the host) |
INFLUX_TOKEN |
(unset) | InfluxDB API token (see .env / smoking-pi passwords --show-secrets) |
INFLUX_ORG |
smokeping |
InfluxDB organization |
INFLUX_BUCKET |
smokeping |
InfluxDB bucket |
MCP_TRANSPORT |
stdio |
stdio or http (streamable-http) |
MCP_HOST |
0.0.0.0 |
Bind address for the http transport. Compose sets 127.0.0.1 unless .env overrides it (the service runs on the host network); the only supported override is a tailnet address, see remote-openclaw.md |
MCP_PORT |
8090 |
Listen port for the http transport |
OPENCLAW_URL, OPENCLAW_GATEWAY_TOKEN, OPENCLAW_CHANNEL, OPENCLAW_TO |
(unset) | Where get_chart(deliver=true) posts the PNG — the alerter's delivery settings, reused verbatim (see docs/alerting.md) |
CHART_THEME, CHART_MAX_BYTES |
light, 700000 |
Chart rendering, shared with the alerter |
PUBLIC_BASE_HOST |
(unset) | Host the reader reaches this Pi on; enables deep links (below) |
GRAFANA_PUBLIC_URL |
(unset) | Full Grafana base URL; wins over PUBLIC_BASE_HOST |
WEB_ADMIN_PUBLIC_URL |
(unset) | Full web-admin base URL; wins over PUBLIC_BASE_HOST |
TUNNEL_BASE_HOST |
(unset) | Host reachable from outside the home network; adds a _tunnel twin to every link |
GRAFANA_TUNNEL_URL |
(unset) | Full from-anywhere Grafana base URL; wins over TUNNEL_BASE_HOST |
WEB_ADMIN_TUNNEL_URL |
(unset) | Full from-anywhere web-admin base URL; wins over TUNNEL_BASE_HOST |
On-request charts
get_chart is the one tool that returns a picture, and it does so only when
called — no other tool attaches images to its answer, so an ordinary "how is
my internet?" stays text. It exists for the moment the number is not enough:
the user wants to see the shape of the last day, or wants something to hand
to a person with no login here — a housemate, a friend, the ISP.
What it draws, for one target and one window (1–720 h, default 24):
- Median latency as the line, with the spread of the individual pings shaded around it — an outer min–max band and an inner-quartile band, the same "smoke" SmokePing's own graphs show. A jittery-but-alive link and a clean one can share a median; the band is what tells them apart.
- Packet loss underneath, on an axis pinned to 0–100 so 4 % never looks like a catastrophe.
- Major and minor gridlines, local-time axis, the last value labeled, and a footer naming the source and when it was drawn — because the image is meant to leave the chat it was made in, and once it does nothing else says where it came from.
with_peers=trueadds the target's same-category peers as faint lines, so "is it this host or everything?" is visible in one picture.
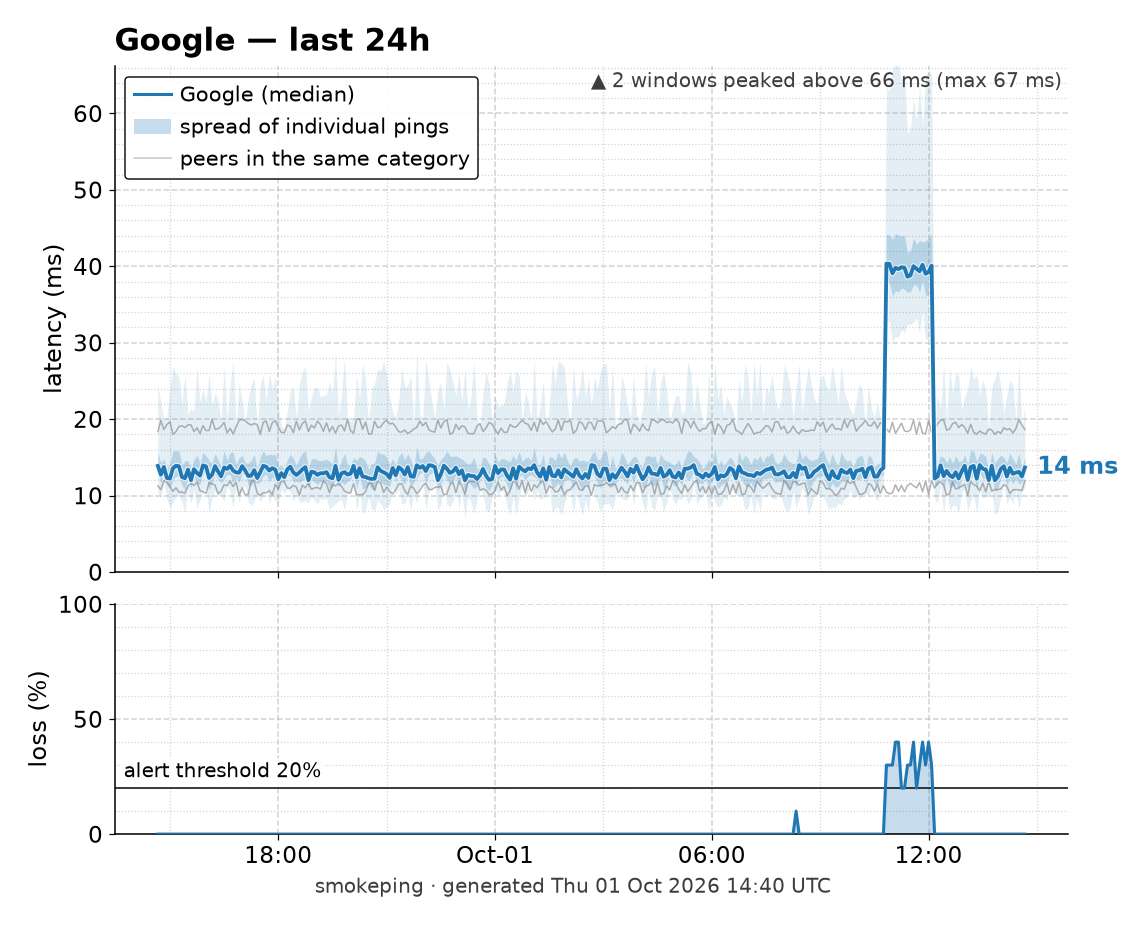
A 24-hour window with a congestion episode: the median triples, the spread
widens with it, and loss crosses the threshold, while here the peers stay
flat. That is the picture "is it this host or everything?" is asked of. (Invented data, drawn
by the real renderer: tools/chart-examples/render.py.)
The PNG comes back as an MCP image block, which Claude Desktop, Claude Code and OpenClaw all render, plus a JSON block with what was drawn and the Grafana links for the same view. The rendering is matplotlib in-process (about a second on the Pi), never Grafana's image renderer, which is a headless Chromium this hardware cannot afford.
deliver=true posts the file into the OpenClaw chat through the same
Gateway endpoint the alerter uses, with the same OPENCLAW_* settings. This is
the piece that makes sharing work from Telegram: OpenClaw's agent can see an
MCP image but cannot forward it on its own, so the server hands the file to
the chat directly and the user forwards it from there. The result reports
delivered: true or a delivery_error that says why not (no token, no
recipient, tool blocked by policy, gateway unreachable) — the image is
returned either way.
The picture is a static file the user chose to send. It is not a public URL:
Grafana snapshots stay switched off (see CHANGELOG.md, 2.7.0), and nothing
here publishes anything.
Names: use the exact target name from list_targets, or the CPE gateway's IP
as get_microcut_stats reports it — the gateway is discovered rather than
configured, so it is not in the target list.
Deep links
Tool responses can carry a links object pointing at the target's own Grafana
dashboard (its pings, cycle by cycle), every layer measured for it on one
page, a side-by-side against its peers, and the web-admin page for editing it:
{"target": "Amazon", "median_ms": 21.4, "avg_loss_pct": 0.0,
 "links": {
   "graph": "http://192.168.1.10:3000/d/individual-pings-v1?var-target=Amazon&from=now-24h&to=now",
   "all_layers": "http://192.168.1.10:3000/d/target-detail-v1?var-target=Amazon&...",
   "compare_with_peers": "http://192.168.1.10:3000/d/side-by-side-v1?var-category=topsites&...",
   "edit": "http://192.168.1.10:8080/targets/?q=Amazon"}}
all_layers opens the Target Detail dashboard on the
target's base name, so a link built from Google_h2 or Google_tcp443 shows
Google's ICMP, TCP, HTTP and DNS together. The CPE hop and the Wi-Fi link have
no such page.
get_microcut_stats goes further and zooms each of its worst-5 windows to a
±15-minute range around when it happened, so the link opens on the event rather
than on the day containing it.
system_status carries the entry points — grafana_overview (the Overview
dashboard),
grafana_cpe_microcuts, grafana_wifi_link, web_admin_targets — each with
a _tunnel twin when a tunnel base is configured. The Wi-Fi dashboard
(wifi-link-v1, variable interface) is linked through links.wifi_links()
rather than target_links(): an interface has a graph and nothing else — no
peers, no web-admin page to edit.
The from/to contract
Two forms, both emitted by links.py and both accepted by Grafana:
| Form | Emitted when | Example |
|---|---|---|
| Relative | a hours= lookback |
from=now-24h&to=now |
| Absolute | an event time (at=) |
from=1788032400000&to=1788048900000 |
Absolute is epoch milliseconds — 13 digits. This is the one part of a generated URL that is safe for a consumer to rewrite: the host cannot be guessed and the dashboard UIDs are a pinned contract, but re-timing an existing link to frame a different window invents nothing. The agent skill uses this to link an incident it is recalling rather than one a tool just returned.
A ten-digit seconds epoch is read as milliseconds and lands in January 1970 — valid-looking, silently wrong, and not something Grafana will complain about.
This is off until you configure it, on purpose. The Pi has no canonical
hostname — a LAN IP, a Tailscale name, and possibly a Cloudflare tunnel all
reach it, and which one works depends on where the person reading the answer is
standing. A guessed http://localhost:3000 would look right in the transcript
and fail silently on someone's phone, so with nothing configured the tools
return numbers and no links at all. system_status() reports that deep links
are unconfigured; the measurement tools stay quiet about it rather than
repeating the notice on every call.
Deep links are also disabled under TSDB_TYPE=clickhouse. Every dashboard
UID above comes from the InfluxDB provisioning tree; the ClickHouse tree is a
parallel set with different UIDs and no CPE dashboard at all, so each of these
links would resolve to a Grafana 404 while looking perfectly valid in the
answer. Same doctrine as the unset base URL: no link beats a broken one.
system_status() says which of the two reasons applies.
The short way (Pro):
sudo smoking-pi links --lan auto                              # this machine's LAN address
sudo smoking-pi links --lan mdns                              # its .local name (smoking-pi.local)
sudo smoking-pi links --tunnel https://smokingpi.example.com  # from anywhere
sudo smoking-pi links                                         # show where links point
--lan auto takes the address the local network sees: the source of the
default route, not the address an SSH session came in on, which can be a
tailnet address that a phone on the Wi-Fi can't open. --lan mdns stores the
.local name the mdns service holds: a name instead of an
address, which survives a new DHCP lease. It takes the name held now, so
after a conflict it is smoking-pi-2.local, and smoking-pi links warns
if the stored name and the held one part ways. Only a device that resolves
.local names can open such a link, so check on the phone that reads the
alerts; --lan auto is the address every device can open.
--lan https://host suits a reverse proxy on the LAN, where no port is
added. --tunnel refuses an
address without its scheme. The alerter and the MCP server are
recreated to pick it up. By hand, set one variable for the common case:
# editions/pro/.env — standard ports (:3000, :8080) are appended
PUBLIC_BASE_HOST=192.168.1.10
PUBLIC_BASE_HOST=smokingpi.tailnet-name.ts.net
PUBLIC_BASE_HOST=2001:db8::5          # becomes http://[2001:db8::5]:3000
An IPv6 literal is bracketed for you, with or without brackets as given
([2001:db8::5]:9999 keeps its port). A link-local fe80:: address is
ignored, with a warning in the service log: it only routes with a zone id
(%wlan0), and browsers refuse zone ids in a URL. Pro's web admin
publishes 0.0.0.0:8080, IPv4 only, so its links do not open over IPv6;
Grafana's do.
Or set both URLs where a proxy or tunnel hides the ports:
GRAFANA_PUBLIC_URL=https://grafana.example.com
WEB_ADMIN_PUBLIC_URL=https://admin.example.com
smoking-pi links sets these and recreates what reads them; with smoking-pi config set, the same.
Two tiers: at home, and from anywhere
The variables above answer "where is the reader standing" once. In practice the same person asks from the couch and from a train, and there is no single right answer: a LAN address is the better link at home — one hop, and up even when Cloudflare isn't — and a dead link on cellular.
So the tunnel address is configured separately, and every link is emitted twice:
PUBLIC_BASE_HOST=192.168.1.10                    # at home
TUNNEL_BASE_HOST=https://smokingpi.example.com   # from anywhere
{"links": {
   "graph": "http://192.168.1.10:3000/d/individual-pings-v1?var-target=Amazon&...",
   "graph_tunnel": "https://smokingpi.example.com/d/individual-pings-v1?var-target=Amazon&...",
   "edit": "http://192.168.1.10:8080/targets/?q=Amazon",
   "edit_tunnel": "https://smokingpi.example.com/targets/?q=Amazon"}}
Same panel, same window, different host. system_status() twins its three
entry points the same way (grafana_overview_tunnel, …).
Three behaviors worth knowing, each of which exists to keep a link from lying:
- Tunnel only is fine. With
TUNNEL_BASE_HOSTset andPUBLIC_BASE_HOSTempty, the tunnel becomes the primary link — a Pi reachable only through a tunnel gets links rather than silence — and no_tunneltwins are emitted. - Identical bases are not twinned. Configuring the same address in both tiers produces one link, not two. Two labels on one URL invites a reader to try "the other one" when there isn't one.
- Quick tunnels expire.
smoking-pi tunnel startgets a fresh*.trycloudflare.comhostname on every start; setting one withsmoking-pi links --tunnelworks until the next start, after which the twins 404. Use a named tunnel if these links are going into alerts.
smoking-pi tunnel prints the current hostnames.
Two things worth knowing:
- The dashboard UIDs are pinned in
links.pyand asserted against the provisioned dashboard JSON by a unit test, so renaming a dashboard's UID fails CI rather than producing links that 404. - The database's category vocabulary (
top_sites,netflix_oca,dns_resolvers) differs from the category tag the exporter writes into InfluxDB (topsites,netflix,dns).links.pymaps from the database vocabulary, because that is whatlist_targetsreturns.
The web-admin AI chat does not yet include links in its tool results. Its
diagnose_loss and get_incident_history share this server's code
(common/incident_answers.py), but web-admin is given no link settings, so
their graph fields stay empty; its other tools are its own copies. Its
system prompt says so: where the guide asks for a link, the chat names the
dashboard and the time, and never writes a URL itself. The pages it renders already build
correct Grafana links client-side from window.location.hostname — which needs
no configuration at all, since the reader is by definition already on the host
that works.
Option A — stdio, for Claude Code on the Pi
Install the dependencies once (system-wide, in a venv, or with pipx):
cd ~/smoking-pi/shared/modules/mcp-server
python3 -m venv ~/.mcp-smokeping-venv
~/.mcp-smokeping-venv/bin/pip install .
Then register the server with Claude Code. Because the tools talk to
containers from the host, point the URLs at localhost and pass the InfluxDB
token (find it in editions/pro/.env or via smoking-pi passwords --show-secrets):
claude mcp add smokeping \
  -e CONFIG_API_URL=http://localhost:5000 \
  -e INFLUX_URL=http://localhost:8086 \
  -e INFLUX_ORG=smokeping \
  -e INFLUX_BUCKET=smokeping \
  -e INFLUX_TOKEN=<your-influxdb-token> \
  -- ~/.mcp-smokeping-venv/bin/python3 /home/smokingpi/smoking-pi/shared/modules/mcp-server/main.py
(python3 /path/to/main.py works too if the deps are installed system-wide.
Add -e CONFIG_API_TOKEN=... if the config-manager API is protected.)
Option B — Docker Compose service (streamable-http)
The mcp-server service is wired into editions/pro/docker-compose.yml.
It is opt-in via the mcp profile so the default stack is unchanged:
  mcp-server:
    build:
      context: ../../shared
      dockerfile: modules/mcp-server/Dockerfile
    container_name: smokeping-mcp-server
    restart: unless-stopped
    profiles: [mcp]
    network_mode: host
    environment:
      - MCP_TRANSPORT=http
      - MCP_HOST=${MCP_HOST:-127.0.0.1}
      - MCP_PORT=8090
      - CONFIG_API_URL=${MCP_CONFIG_API_URL:-http://127.0.0.1:5000}
      - CONFIG_API_TOKEN=${CONFIG_API_TOKEN:-}
      - INFLUX_URL=${MCP_INFLUX_URL:-http://127.0.0.1:8086}
      - INFLUX_TOKEN=${INFLUX_TOKEN:-}
      - INFLUX_ORG=${INFLUX_ORG:-smokeping}
      - INFLUX_BUCKET=${INFLUX_BUCKET:-smokeping}
      # ... deep links, mute files, OPENCLAW_* for get_chart delivery
    depends_on:
      - config-manager
The service runs on the host network, like the alerter and for the same
reason: the OpenClaw gateway listens on the host's loopback only (which is the
right setting — keep it), and no bridge network can reach that. MCP_HOST
pins the listener to 127.0.0.1, so exposure is exactly what the earlier
127.0.0.1:8090:8090 port mapping gave: nothing on the LAN can see the server.
Start it with:
sudo smoking-pi enable mcp
The MCP endpoint is then http://127.0.0.1:8090/mcp (bound to localhost
only). Register it with any streamable-http-capable MCP client, e.g.:
claude mcp add --transport http smokeping http://127.0.0.1:8090/mcp
Note: the env var names on the right-hand side (
INFLUX_TOKEN,INFLUX_ORG,INFLUX_BUCKET) match the Pro edition's.envgenerated bysetup.sh; adjust if your.envuses different names.
Example conversation prompts
Once connected, ask things like:
- "Were there microcuts last night?"
- "Add monitoring for 9.9.9.9" (then: "call it quad9 and put it in the dns category")
- "Which targets had the worst p95 latency in the last 6 hours?"
- "Did we drop packets to Google DNS this week? Show me when."
- "Pause monitoring for the netflix targets, then apply the config."
- "Is the monitoring stack healthy? SmokePing seems down."
- "Show me a chart of Cloudflare DNS for the last 24 hours" (a PNG comes back)
- "Send me a picture of the gateway for the last week so I can forward it to
the ISP" (
get_chart(..., hours=168, deliver=true)— it lands in the chat as a file)
Registry
server.json at the repository root is the MCP Registry description of
this server (io.github.estcarisimo/smoking-pi). The package it names is
the OCI image ghcr.io/estcarisimo/smoking-pi/mcp-server:<version>. No
workflow publishes server.json; putting it on a registry is a step the
maintainer takes by hand, after the image with that tag exists.
The image label io.modelcontextprotocol.server.name is the same string,
on the Dockerfile and again on the mcp-server build in release.yml.
That workflow is the only publish: a vX.Y.Z tag pushes
ghcr.io/estcarisimo/smoking-pi/mcp-server:X.Y.Z for both architectures,
and :latest moves only after the install tests pass. Pull requests build
the image and do not push it.
A registry client is told to run that image over stdio (MCP_TRANSPORT=stdio,
host network, the config API and InfluxDB on loopback). The Smoking Pi
stack does not use that path: smoking-pi enable mcp serves streamable
HTTP on 127.0.0.1:8090/mcp. Either way the tools read a Pro stack that
is already running.
On a release, bump version and the tag in the package identifier
together with CITATION.cff. A file left on the previous version names an
image the new release did not push.
Development
cd shared/modules/mcp-server
python3 -m venv .venv && .venv/bin/pip install -e ".[dev]"
.venv/bin/pytest -q                       # unit tests (no network needed)
.venv/bin/ruff check --select E9,F63,F7,F82 .