Detection reliability
After several weeks of use the reference installation reported too many false positives from two detectors: downtime (a target, or everything, is down) and microcuts (brief loss on the local link). This page is the record of both investigations — the real alerts, what the measurements actually showed, what each should have said, and what changed. The two are independent efforts with separate evidence and separate backlogs; a fix to one says nothing about the other.
All evidence is from the reference Pi (Pro edition, InfluxDB, measuring across a Wi-Fi uplink) between 2026-08-21 and 2026-09-20. Times are UTC.
Where a detection reaches you
A "detection" arrives by one of two routes, and they have different definitions:
- The alerter (
shared/modules/alerter/, alerting.md): rules evaluated every minute, delivered to Telegram through OpenClaw whenNOTIFY_MODEis notoff, summarized in the weekly summary when the week had something worth telling. - The assistant (the OpenClaw skill over the MCP tools,
mcp-server.md):
get_loss_eventsandget_microcut_statsare what answer "how is my connection?", and each has its own threshold, separate from the alerter's.
On the reference Pi delivery has been off throughout, so every report
the operator read came from the assistant, whose two tools counted
differently from the rules they mirror. That is the first finding: the
rules had already learned about the CPE loss floor and window jitter; the
tools had not.
Downtime
Evidence
Loss points in latency over 30 days: 94,992 at zero, 3,828 at exactly one
lost ping (10%), 237 at 15–30%, 80 at 35–99%, and 27,260 at 100%. Nearly a
quarter of all points were total loss. Every one of those belonged to one of
three events, and none of the three was a target being down:
| When | What the measurements show | What was reported | What it was |
|---|---|---|---|
| 2026-08-22 → 08-30 (9 days) | 9 hostname targets at 100% every cycle (2,592 points/day); every IP-addressed target (resolvers, OCA caches, gateway) clean | "several web targets show ~90% loss for the week" | The SmokePing container's resolv.conf froze after a Tailscale logout; names stopped resolving. Fixed in the 2026-08-31 batch (container DNS pin; doctor check container-dns-fresh). The monitor, not any target. |
| 2026-09-02 22:35 → 09-03 19:35 (21 h) | Every target at 100%, the LAN gateway and the ISP first hop included; no reboot; recovered on its own | (alerter logs from then are gone; by the rules: 18 target_down + 18 high_loss, re-sent hourly) |
Same signature as the next row. This host's uplink. |
| 2026-09-20 01:40 → 04:58 (3 h 20 min) | Every target at 100%. wifi_link: associated to the AP at −49 dBm, uplink=1, ~570 packets transmitted per 10 min (the probes going out) and 0 packets received for the whole span; ended with a reboot |
18 target_down criticals + 18 high_loss warnings + 1 microcut_burst, each re-sent at every cooldown: ~110 notifications for one fact. The verdict line said "local link cutting out" |
This host's Wi-Fi radio hung — brcmfmac with power save on (iw dev wlan0 get power_save → on), the well-known "connected, receiving nothing" failure. Nothing beyond the radio could be judged. |
| 2026-09-19 00:42 → 00:45 (3 min) | Six consecutive CPE windows at 100% (a real cut); every target got ONE cycle at 60–80% loss; its 15-minute mean cleared 20% | 18 high_loss warnings at 00:45–00:46, 18 recoveries at 01:10 |
One brief cut of the link, reported 36 times. The microcut_burst for it was correct. |
| Every day | 60–317 points/day at exactly one lost ping of ten, spread evenly over all 18 targets (Amazon 207, UBA 203 … SpotifyWebPlayer 155 over Sep 5–19); 0–56 points/day at 15–99% | get_loss_events(min_loss_pct=5) listed every one; the assistant answered "packet loss last 6h: yes — 3 target loss events ~9%" |
The Wi-Fi hop's background. One lost ping in a 10-ping cycle is not an event. |
What is not in the table matters too: in 30 days there was no genuine
single-target outage (the only per-target 100% runs outside those events are
Google6, which has no IPv6 route to answer over). The detector's false
positives were all of one kind — one event with one cause, reported once
per target, plus a background counted as events.
Expected classification
- Every target lost every packet for several cycles → one critical,
scope this host: the uplink is down; nothing beyond it can be judged.
When
wifi_linkshows the radio associated and receiving nothing, say that — it is the one failure the router's lights cannot show. - Every target lossy in the same cycle, then fine → one warning: a brief cut of the link, at this time, for this long. No recovery notice — it had already ended.
- One target over the mean-loss threshold from a single bad cycle → nothing. Loss has to last two cycles to be "high loss".
- One lost ping of ten → not an event; count it as background.
What changed
Alerter (evaluator.py, verdict.py, state.py):
rule_widespreadreads the raw down-window points per probe cycle. WhenWIDESPREAD_PCT(80%) of the reporting targets are at 100% in each of the latest three cycles it emits one critical, named by what still answers (since PR 4 of the front-8 audit):uplink_downwhen the ISP gateway is lost too,internet_downwhen it answers,monitor_dnswhen it and the resolvers answer by address while every named site is lost; otherwise a run of cycles in which that share lostWIDESPREAD_LOSS_PCT(30%) becomes oneoutagewarning keyed by its first cycle.suppress_widespreaddrops everytarget_downandhigh_losswhile either is active (andmicrocut_burstunderuplink_down, where "99 windows over 50%" says nothing the critical did not).high_lossneeds persistence:HIGH_LOSS_MIN_POINTS(2) cycles above 15% within the mean's own 15 minutes, not one bad cycle averaged over the threshold.- New verdict scope
monitor_uplink(🔌), right aftermonitoring. The evaluator now also fetches the packets-received increase for the Wi-Fi uplink over the down window; zero while associated is named as a hung radio, with the fix in the line. outageis transient: the state machine alerts once and drops it without a recovery.
Assistant (get_loss_events, and common.aggregates.LOSS_EVENT_PCT
which the AI report uses):
- Default
min_loss_pct5 → 15: two or more lost pings, or any lost DNS query. The excluded single-ping points are returned asbackground_pointsso the assistant can say they exist. (Since replaced by a count: two or more lost pings of whatever the probe sends,common.cadence.EVENT_LOST_PINGS; see Probe cadence.) episodes: consecutive points per target folded into one, with start, duration, worst loss and whether it was total.widespread: runs of cycles in which 80% of the reporting targets had an event, with acauseline — this host's uplink when every target lost every packet for three cycles or more (the alerter's own bar), a brief cut of the link otherwise. Roll-ups are computed from up to 5,000 rows, so a three-hour cut across 18 targets (720 points) is not misread from the newest 500.
Replayed against the evidence
Each event above is a test that feeds the detector the rows it saw that night
and asserts what comes out (alerter/tests/test_evaluator.py,
test_verdict.py, test_state.py; mcp-server/tests/test_tools.py):
| Event | Before | After |
|---|---|---|
| 2026-09-20 hung radio | 37 incidents, ~110 notifications over the night | 1 uplink_down, re-sent at the cooldown: 4 notifications, line "still associated at −49 dBm but it has received nothing … the radio is hung, not the network" |
| 2026-09-03 (21 h) | 36 incidents per hour of cooldown | 1 uplink_down; without wifi_link data the line is the generic "this host's uplink" |
| 2026-09-19 blink | 18 warnings + 18 recoveries | 1 outage warning, no recovery; microcut_burst unchanged |
| a single target's bad cycle | 1 high_loss warning + recovery |
nothing |
| 143 single-ping points in a day | 143 "loss events" | 0 events, background_points: 143 |
The 2026-08-22 name-resolution failure is not specifically classified: its
root cause was fixed and the doctor checks for it. If it recurs it would read
as nine target_down incidents with the verdict "9 of 18 affected — not a
clear pattern", which is honest if not helpful. Backlog below.
Downtime backlog
- Turn off Wi-Fi power save on the reference Pi. Not a detector change and not done by the PR that added this page — it is a host setting and the operator's call. Decided 2026-09-20: documented, not applied. Applied 2026-10-01 17:15:07 UTC after a third outage. What is known, what is only suspected, why the change is sensitive on a headless Pi that measures through the same radio, and how to try it so that it undoes itself are in When the radio hangs.
- Classify "every hostname target down, every IP target fine" as name resolution on the monitor. Needs the alerter to know each target's host, which it does not today.
- A doctor live check for a radio that is associated and receiving nothing, so the condition is visible before the alerter has to infer it.
Microcuts
Evidence
cpe_latency windows over 14 days (10 s at 5 pps, one every 30 s; loss is
a percent, so every value is a multiple of 2%):
| Window loss | Windows |
|---|---|
| 0% | 594 |
| 1–10% | 24,260 |
| 11–30% | 12,733 |
| 31–50% | 249 |
| 51–99% | 17 |
| 100% | 417 (all of them the 2026-09-20 hang) |
The gateway's ICMP rate limit is the floor: per day the 90th percentile of
window loss sits at 14–22%, and 98% of all windows show some loss. Above
MICROCUT_LOSS_PCT (50%), outside the hang, fourteen days held 17
isolated single windows at 52–78% — thirteen of them on Sep 7–8, the
gateway's worst days (p90 22%, 101 windows at 31–50%) — and one real cut:
six consecutive windows at 100% on 2026-09-19 00:42–00:45.
Against that, what the two detectors do:
get_microcut_statsreportslossy_windowsas windows with any loss (≈98% of them — meaningless) and always returns a top-5worst_windows, so on a quiet day the five worst floor windows (31–50%) come back looking like cuts. The assistant duly reported "strong microcuts last night, worst 82%" (Aug 7), "worst window 20% recently" (Aug 30) and "the gateway keeps microcutting" for what was the floor's tail.- The alerter's
microcut_burstcounts windows above 50% in the last hour and fires atMICROCUT_BURST_N= 2. On Sep 7 two isolated windows 23 min apart (10:17, 10:40) and again 48 min apart (19:02, 19:50) were each a "burst"; during the Sep 20 hang it reported "99 windows over 50%" beside eighteen criticals saying the same thing (now suppressed underuplink_down, above).
Expected classification
- A cut is a run of consecutive windows above
MICROCUT_LOSS_PCT, or a single window at 100%. Its duration is the run's span. - An isolated window at 51–99% is a possible cut: five seconds of nothing is real, but one in a day on a rate-limited gateway is not a pattern. Report it as such, not as "strong microcuts".
- 31–50% is the floor's tail; ≤ 30% is the floor. Neither is a microcut, and a day with many tail windows is "the gateway had a bad day", which is worth one sentence with the p90, not a list.
- A burst is several cuts in an hour, not several windows.
What changed
One definition, in shared/modules/common/microcuts.py, read by every
consumer: a cut window is above MICROCUT_LOSS_PCT (50%); a cut is
a run of cut windows with at most one missing window between them (30 s
cadence, GAP_S = 70), its duration first-to-last plus the window; it is
confirmed with two or more windows or a 100% window, otherwise
possible. The floor is the window-loss p50 / p90.
get_microcut_statsreturnscuts(newest first, each withstart,seconds,windows,max_loss_pct,total,confirmed, and a link zoomed to its moment), per-targetwindows/cut_windows/confirmed_cuts/possible_cuts/p50_loss_pct/p90_loss_pct, the five worst cut windows, and — when there were none — anotethat states the floor and says it is rate limiting, not a fault.lossy_windows(any loss) is gone.- The alerter's
microcut_burstfolds the hour's cut windows the same way and fires on any confirmed cut or onMICROCUT_BURST_N(now 3, was 2 windows) possible ones. Its message names the cut: "1 cut of 2 min 40 s (6 windows, all at 100%)". The verdict's "first hop cutting" signal applies the same bar. - The AI report's CPE summary (
common.aggregates) carry the fields; the report template explains the floor before listing cuts. - The OpenClaw skill's Reading the numbers describes cuts, possible cuts and the floor in those words.
Replayed against the evidence
| Evidence | Before | After |
|---|---|---|
| a quiet day (max window 44%) | five worst_windows at 31–44%, "worst microcut 44%" |
no cuts; note: "no microcuts; the floor sat at p50 10% / p90 18%; rate limiting, not a fault" |
| 2026-09-19 00:42–00:45, six windows at 100% | "6 windows over 50% (microcut burst)", six worst windows | one confirmed cut of 2 min 40 s, all at 100% |
| 2026-09-07 10:17 + 10:40, two isolated windows at 52% and 62% | a microcut_burst warning |
two possible cuts, no alert; three in an hour would alert |
| the 2026-09-20 hang, live over 7 days | — | one confirmed cut of 3 h 25 min (411 windows, total), the Sep 19 cut, one possible cut (Sep 15, 52%); floor p50 10% / p90 16% |
The last row is the tool run against the Pi's InfluxDB before the change
was merged; the others are tests that replay the rows
(mcp-server/tests/test_tools.py, alerter/tests/test_evaluator.py,
test_verdict.py, ai-insights/tests/test_collector.py).
The web-admin assistant reads the same definition. Its get_microcut_stats
(web-admin/app/services/ai_tools.py) was a separate copy that still counted
windows with any loss and always returned a top-5, so the in-UI chat kept
saying "strong microcuts" after the MCP tool had stopped. The web-admin image
now builds from shared/ like the alerter, ai-insights and mcp-server
images, copies common/ in, and the tool calls common.microcuts for the
cut windows, the folding and the threshold; its get_loss_events default
rose from 5% to the shared LOSS_EVENT_PCT (15%; now EVENT_LOST_PINGS) for the reason given under
Downtime. Run against the Pi's InfluxDB beside the MCP tool, the
two answer identically for 24 h and 7 d (web-admin/tests/test_ai_tools_microcuts.py
replays the quiet day, the six-window cut and the two isolated windows).
When the monitor is deaf (2026-10-03)
The definition above settled what counts as a cut. It did not settle whose cut it is. The probe measures through this host's own uplink, so when that radio hangs (associated, receiving nothing: see Downtime) the CPE windows read 100% for a link the host cannot hear, and fold into one long "confirmed cut".
Evidence: the reference Pi, 27 July to 3 October 2026. 255 424 windows;
3 442 above 50% on the IPv4 CPE target, folded into 92 cuts, 14 of them
confirmed. Each confirmed cut was set against wifi_link and the Internet
targets over the same minutes. wifi_link exists from 19 September.
| Confirmed cut | Wi-Fi during it | Internet targets | Whose |
|---|---|---|---|
| 2026-09-20 01:32, 3 h 25 min | associated at −50 dBm, rx_packets flat |
98% loss | this host: the radio hang above |
| 2026-09-26 15:31, 70 s | not associated | 29% mean loss | this host: lost its association |
| 2026-09-27 13:14, 1 h 52 min | associated at −51 dBm, rx_packets flat |
93% | this host |
| 2026-09-27 21:11, 13 min | associated at −46 dBm, rx_packets flat |
19% | this host |
| 2026-10-01 14:43, 37 min | associated at −58 dBm, rx_packets flat |
70% | this host |
| 2026-09-25 08:04, 6 min | associated; receiving dropped from 66 to 4 packets/s, not to 0 | 28% | the link (unproven either way, so the old reading stands) |
| 2026-09-19 00:42, 2 min 40 s | before wifi_link |
38% | the link: the one real cut in the record |
Since wifi_link began, every confirmed cut with Wi-Fi evidence but one was
the monitor's own radio, and each was reported as a microcut by the MCP
tool, the web assistant, the AI report and microcut_burst. Outside those
spans the counter never stood still: the 2 229 deaf 10 s samples over 18
days add up to the five spans' 22 160 s, almost exactly. A real cut beyond
the radio leaves the LAN talking (the router forwarding the house's DNS,
ARP, multicast), so a flat counter is the radio, not the line.
What changed. common.microcuts.attribute marks each cut origin:
"this_host" (with deaf: received nothing or not associated) when
deaf samples run through all of it, counted only while their interface holds
the default route (a disassociated sample inherits that from the last
associated one), so a spare radio, or the Wi-Fi after Ethernet took the
route, proves nothing. One hang seen on several CPE series is one span. It allows one missed
sample, reads nothing after the cut (the long hangs end in a reboot, which
resets the counter), and treats a wired host or a missing wifi_link as no
evidence, so every cut stays the link's. uplink_flux asks InfluxDB for the
deaf samples only. Every consumer takes those spans out of cuts, the
counts, worst_windows and microcut_burst, and reports them apart:
deaf and deaf_note ("this host's Wi-Fi heard nothing for 2 h 43 min (3
spans): the monitor was deaf, not the link cut"). uplink_down already
names the hang while it lasts. Replayed on the record above, the seven days
to 3 October go from "3 cuts, the longest 1 h 52 min" to no confirmed cut,
the same two possible ones, and one deaf_note for the three hangs.
Not changed: the 78 possible cuts (single windows at 52–78%). They alerted twice in 68 days (8 and 9 August, three or more in an hour), and 28 of them coincide with Internet loss above 20%, so they are not all the floor.
Grafana caught up on 2026-10-13. The Overview's ISP gateway cut
windows stat still counted every window above 50%, the radio's deaf spells
included. On the staging Pi over seven days that was 2 083 windows in red, of
which 2 050 fell in one 17-hour hang. The stat now splits them with the same
evidence (wifi_link samples whose interface held the default route and
whose received-packet counter did not move, or that were not associated):
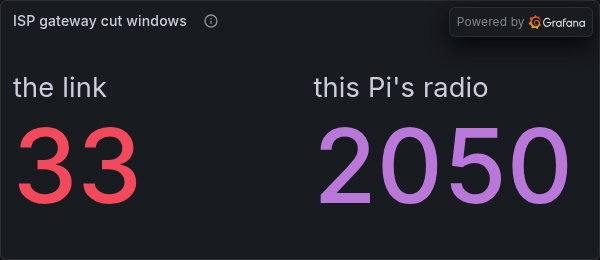
The split is made per window. A cut that the deaf samples cover only in part
stays the link's in attribute() but is split here, so the stat can differ
by a few windows from get_microcut_stats (33 against 37 for those seven
days).
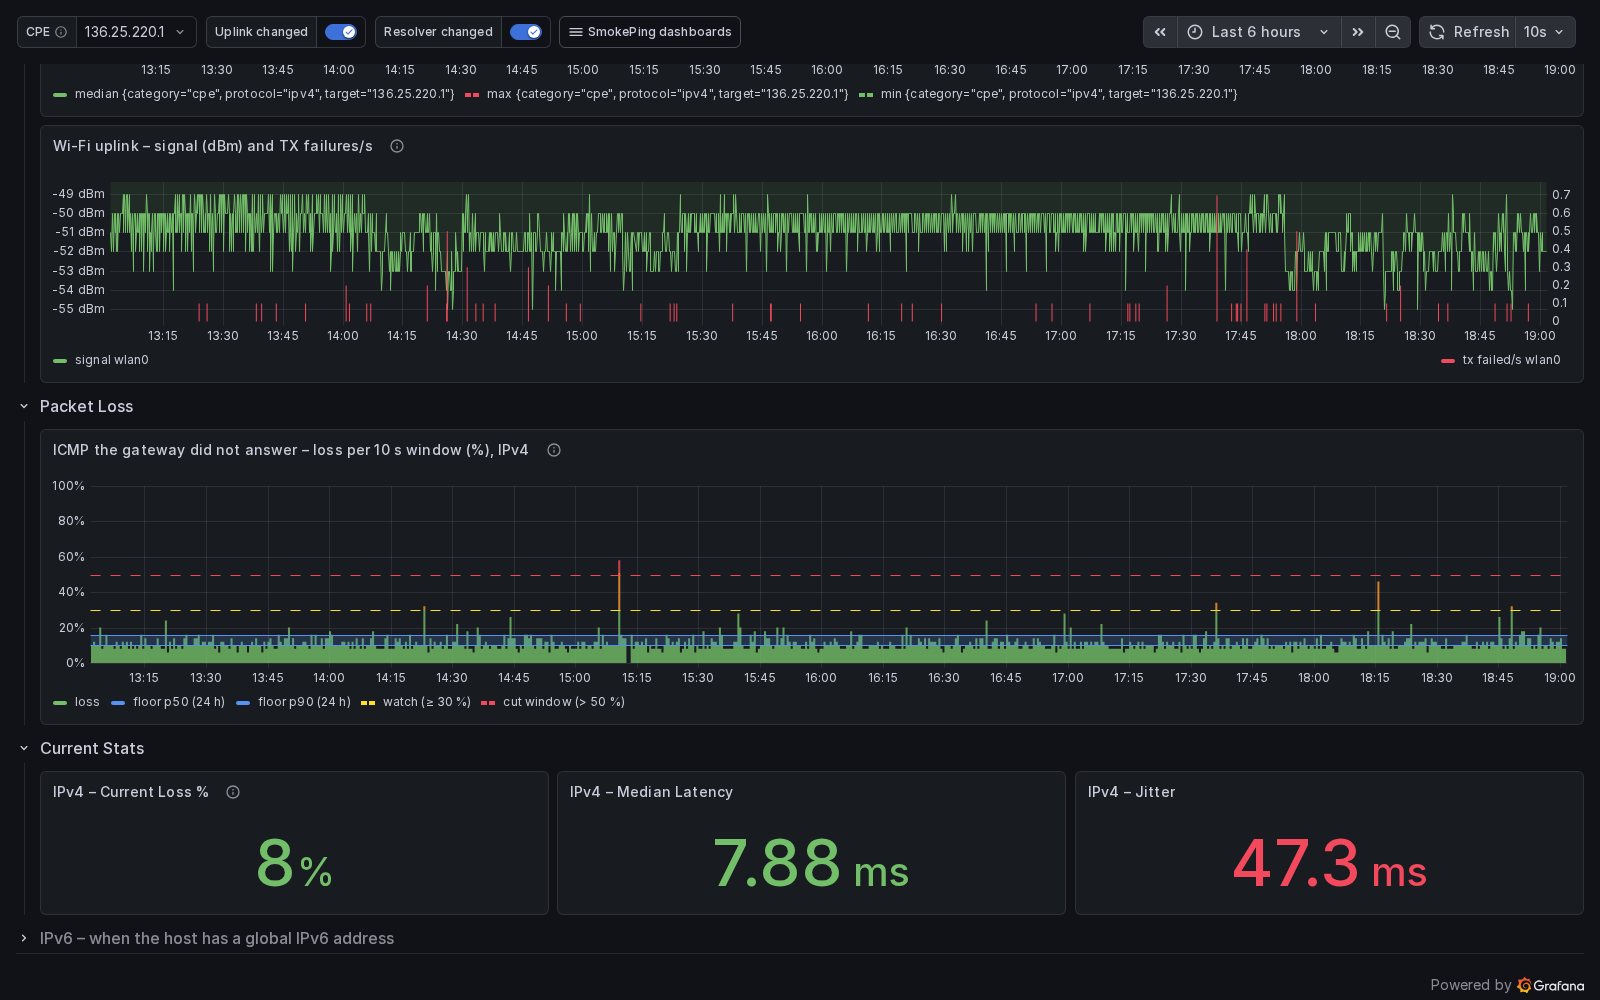
The CPE Microcut Detection dashboard turned yellow at 1% and red at 5%, so a gateway sitting on its normal rate-limit floor was red all day. Its loss panels and stat tiles are now yellow at 30%, above the floor's p90, and red above 50%, which is a cut window:

The thresholds alone still read as "40% packet loss" to someone who did
not know the gateway rate-limits ICMP (the maintainer, reviewing production
on 2026-10-17). Since the release after v2.40.0 the loss panel is titled ICMP the gateway
did not answer – loss per 10 s window (%), its legend names the two lines
(cut window (> 50 %), watch (≥ 30 %)) and draws the gateway's own
floor over the last 24 hours as a band from the median window (p50) to the
90th percentile (p90), computed in InfluxDB with quantile over the same
cpe_latency rows (no new probe; the last 24 hours from now, whatever
range is shown). The bars are colored by value with the tile's steps.
Bars inside the band are the floor; on
the reference gateway it sat at p50 10% / p90 16% on 2026-10-17. The
Current Loss % tile explains the same in its description and colors
below 30% green, 30–50% orange and above 50% red:
Microcut backlog
GAP_Sand the 30 s cadence are constants; ifCPE_PROBE_IDLEis changed they must follow by hand.- The web-admin assistant's
get_loss_eventsstill lists points newest first; theepisodes/widespreadfolding lives inmcp-server/server.py, not incommon. Move it there when either side is next touched, so the in-UI chat can name a hung radio the way the MCP tool does. - A cut on a wired host has no deaf test: an Ethernet link that stops receiving is not measured by anything today.
Diagnosis: what each episode was
Both detectors above answer one question each. The question the assistant is
actually asked is wider: what happened last night, and was it me? Until
2026-10-04 it answered by reading get_loss_events, get_microcut_stats and
get_wifi_stats and attributing on its own, which is how a hung radio could
still be called an outage. diagnose_loss(hours) does the attribution once,
deterministically, in shared/modules/common/diagnosis.py.
An incident is a run of probe cycles in which some target lost two or
more pings (the get_loss_events rule), across every target at once — or a
confirmed microcut or deaf span with no such run around it. The ISP's first
hop as a target (CPE_IPv4, category cpe) is not a destination: its ping
loss is the gateway's rate-limit floor, and the 10 s CPE probe is the
first-hop evidence. Each incident gets one class:
| Class | What it means | Read from |
|---|---|---|
probe_miss |
One point on one target, nothing else moved | a single lossy point; its TCP/HTTP sibling answering makes it high |
local_wifi |
This host's own Wi-Fi: deaf, disassociated, carrier, weak_signal |
deaf and disassociated: deaf spans (as in the microcut section) or lost association covering at least half the incident; carrier: a carrier drop in an incident of three cycles or fewer; weak_signal: a minute of samples under −75 dBm with a first-hop cut or broad loss. Shorter faults inside a longer incident are listed in against |
local_link |
The line between the house and the ISP: outage, cuts, degraded, microcut |
total loss while the radio still received; first-hop cuts with two or more destinations; the first hop's per-cycle loss 10 points over its usual level along with everything else |
monitor |
Every named destination lost while the first hop and the resolvers queried by address answered (names): this host's own DNS |
the first hop's loss at its usual level; resolvers reporting and absent from the incident |
destination |
One or two destinations, their peers fine (dns, ipv6) |
breadth, repeat cycles, the TCP/HTTP sibling failing too |
upstream |
Beyond the line: most destinations at once, or spread — a low-grade loss on most paths, never most at once — with a normal first hop |
breadth per cycle and over the incident; the first hop's loss at its usual level |
unclear |
None fits | listed with the first hop's and the Wi-Fi's state anyway |
Confidence is high when two or more signals support the class and none
contradicts it, medium with one, and low when something contradicts it
(each such line is in against). A class that needs evidence the host does
not have — the first hop for local_link/upstream, wifi_link to tell a
dead line from a dead host — is never high, and coverage says what
existed. spread is an inference from a normal first hop and is capped at
medium; unclear is always low.
The spread rule rests on one observation: the CPE probe sends 5 packets a
second across the same Wi-Fi and the same line as every other probe. A
low-grade loss on most paths with the first hop at its usual floor did not
happen on the air or the line.
Replayed on the reference and staging Pis
On the reference Pi, the week to 2026-10-04 (18 destinations reporting from 2 October, 19 before; the first-hop target is not counted):
- the 2026-10-01 radio hang came out
local_wifi/deaf,high: 37 of 40 minutes deaf, 18 of 18 destinations lost; - five lone two-ping points are
probe_miss; three single-site losses aredestination,high(uba_arandFacebookfor two cycles each,Amazonat 100% for 230 minutes on 2026-09-28); - a 35-minute night episode on 2026-10-02 from 00:55 is
upstream/spread,medium: 11 of 18 destinations lost a ping or more, at most 38% of them in one cycle, the first hop at 10% against its usual 11%, the Wi-Fi never weaker than −56 dBm; - five more short night-time episodes (starting between 01:35 and 03:10)
are
unclear,low: 3 to 6 destinations, at most 22% in one cycle, the first hop at its usual 10–12% and the Wi-Fi at −50 to −60 dBm. Not the line or the air, not one site, and below the bar forspread; - 27–28 September, the days the Pi's SD card was failing, give two long
unclearepisodes and onelocal_link/outageatlowconfidence (13 deaf minutes inside it, listed inagainst).
On the staging Pi over the same week a 60-minute night episode (9 of 14
destinations, at most 20% in a cycle, first hop at 10% against its usual 11%)
came out upstream/spread, medium; its 2026-09-30 radio hang
(55 of 60 minutes deaf) local_wifi/deaf, high; and an incident with
three deaf minutes inside a five-hour span stayed out of local_wifi, with
those minutes listed in against.
Diagnosis backlog
- The alerter's verdict (
alerter/verdict.py) still attributes on its own; move them ontocommon.diagnosisso an alert and the assistant's later answer cannot disagree. - ~~The web-admin assistant does not have the tool yet.~~ It has
diagnose_lossandget_incident_historysince 2026-10-13, throughcommon/incident_answers.py. - The night-time
unclearepisodes on the reference Pi recur; whether they are this host (a nightly job), the ISP, or something else is unmeasured.