Alerting Engine (alerter)
Deterministic alerting for the Pro edition: a small Python service that evaluates rules against InfluxDB every minute, folds what they find into episodes -- one per physical fact -- and tells you about an episode only when it is worth it: the home's Internet down, a material degradation, their end, and the monitor blind for a quarter of an hour. Delivery is Telegram, an OpenClaw hook or a generic webhook. No LLM involved -- the rules and the policy are plain thresholds, so behavior is predictable and testable.
Module: shared/modules/alerter/. Opt-in via the alerts Compose profile:
sudo smoking-pi alerts --telegram --test # or --openclaw, --webhook (below)
which turns on the profile, recreates the alerter and prints its own
delivery check. sudo smoking-pi enable alerts turns it on alone (it logs
episodes and sends nothing until NOTIFY_MODE points somewhere).
The service runs with network_mode: host, so it reaches InfluxDB on
localhost:8086 and a locally running OpenClaw gateway on
127.0.0.1:18789 without extra wiring.
One episode, one message
Until front 8 (2026-10-30) every rule was its own notification. October on
the reference Pi sent 72 messages for about eleven real events, two of
them actionable: one radio hang arrived as three outages (one per
5-minute bucket), an uplink_down, an exporter_stale, two recoveries and
a microcut; loss at one far destination (a university in Buenos Aires, four
times; one Netflix cache, three) paged like an outage; 15 of 18 recoveries
repeated alerts nobody needed; and the stated cause was often wrong -- "the
line to the ISP" when the Pi had lost its own default route for 30 s, "not
a clear pattern" for a deaf radio the watchdog had just reloaded, "just that
site" for the 10 s cut that reload makes. Replayed against the same month,
the policy below sends about eight messages.
Every minute is one pass through a pipeline (main.run_iteration):
signals -> episode -> classification -> materiality -> policy -> delivery
- Signals (
evaluator.py,watchdog_events.py, the monitor's own health): what the rules found, each with its kind, targets and span. A muted signal stops here. - Episode (
episodes.py): the signals join the open episode, or open one. At most one is open: anoutage, theuplink_downthat follows, the stalled exporter, the watchdog's driver reload and the microcut of the reconnection are one fact, and per-destination loss in the same window is one episode with breadth. It closes once no signal has had evidence forALERT_RESOLVE_AFTER(15 min, never under three probe cycles) -- a signal's evidence is the last cycle its loss was measured, not the last minute its rule's window still held it -- and never while the monitor is blind or no destination reports. - What the monitor could not hear is subtracted first. The episode
keeps the monitor's own blind spans: this Pi's deaf radio (
wifi_linksamples that received nothing), its lost default route (host_uplink), anupgradewindow, a watchdog action, its database unreadable, its exporter stalled. Each is widened by one probe cycle on either side, and a probe cycle or a signal inside one is not evidence about the network. An episode that is all blind is a monitor episode, never an Internet one. - Classification (
common/diagnosis.py,classify_episode): one cause per episode, from the heard minutes, with a confidence and the evidence:
| Class | Cause, as the message says it | When |
|---|---|---|
monitor |
this Pi's radio (monitor blind), this Pi (it lost its own default route), this Pi's monitor (its database could not be read / its measurements stopped arriving), an upgrade, this Pi's own DNS | Nothing about the network was heard, or monitor_dns |
local_link |
your line (the modem or the line to the ISP) | Nearly everything lost with the first hop (the ISP gateway) lost too, or the first-hop probe cut out |
upstream |
your provider, beyond the modem | Nearly everything lost while the first hop answered, or broad loss with the first hop clean |
destination |
just UBA, IPv6 only | One or a few destinations, the rest fine |
undetermined |
undetermined | Below medium confidence -- the first hop unmeasured, or no reading fits. The message says so rather than guess |
- Materiality (
common/definitions.py,materiality()andmaterial()): the single gate, shared with the weekly summary and the MCP tools. See What is material. - Policy (
policy.py): what of the episode is said, and how loud. See What is pushed. - Delivery (
main._deliver): quiet hours, the outbox, the notifier.
What is pushed, and what is recorded
Pushed, and only this:
| What | Message | Sound |
|---|---|---|
The home's Internet down: nearly every destination (WIDESPREAD_PCT) lost everything for three heard probe cycles in a row, and not because the monitor could not hear |
🔴 Internet down since … |
sounds |
| Material degradation (below) | 🟡 Internet with packet loss since … (or Packet loss at one service, IPv6 down) |
sounds by day |
| The end of either | ✅ Internet back after … / ✅ Packet loss over after …: the real duration (the loss itself, not the window), who was affected, and the final cause -- which says "This corrects the first message" when the reading changed |
silent |
The monitor blind for 15 minutes or more (MONITOR_BLIND_MIN_MINUTES) |
🛠 This Pi could not measure the network from … to …: the cause, what the watchdog did, and that what happened on the network meanwhile is unknown. ONE message, once it can measure again; nothing while blind -- the dead man's switch covers that |
silent |
A class change, or a jump in breadth (MATERIAL_BREADTH_PCT points or more) of an episode already told |
🔁 Update on …: one line, the same episode, at most two |
silent; sounds when it escalates to the Internet down |
A per-destination signal that has been active for six hours
(CHRONIC_SIGNAL_S: a host that never answers ICMP, IPv6 on a host
without it) is that destination's state, not an event, and stops counting:
otherwise it would keep the one open episode open forever. The watchdog's
warnings (it could not act) are recorded in the episode, not pushed: the
monitor message tells what it did when the monitor was blind long enough.
Everything else is recorded and never pushed, its end included: loss at
one or two destinations, a cut of the line under a minute
(MICROCUT_MAX_S; the weekly summary counts them), the watchdog's actions
resolved in under 15 minutes, upgrades, resolver changes, a route change of
seconds, and every consequence of an open episode. There is no
re-notification: an episode is said once, and its end once.
The record is state.json's episodes (the open one, and the closed ones
of the last 30 days, at most 500), each with its class, cause, confidence,
evidence, whether it was material and, when not, the conditions it missed
(unmet), and what was pushed about it. The MCP list_alert_state shows
the open one and those of the last day, so "why was I not told?" has an
answer.
What a message says
Every pushed message reads as sentences a home user understands
(templates.py; decided 2026-10-30): the head says what happened and since
when; then the probable cause with its confidence, from the episode's
classification (common/diagnosis.classify_episode); up to three
supporting signals and the strongest contrary one, each with its number,
chosen in a fixed priority -- how many destinations, the router (the first
hop), this Pi's own Wi-Fi and route, the DNS resolvers, a single
destination; and one link to the episode's own range (from one probe
cycle before it to now, or to one cycle after its end), never "the last 6
hours". Below medium confidence the cause line reads Cause:
undetermined. and the reading it suspected is the first signal, marked low
confidence. Destinations are named by their service (the taxonomy's
target_labels: Netflix, uba.ar), never by a target's name, a rule's
name or an AS number. One marker, one clock (DIGEST_TZ). With OpenClaw
connected, an opening message ends Reply "ack" to the assistant to silence
this episode.; with no assistant to reply to, it does not.
The examples below are the October replays (tests/test_messages.py
renders them and asserts this exact text; the first with links configured,
PUBLIC_BASE_HOST=smoking-pi.local, the others without, so with no link
line). The evening of 6 October, at 19:45:
🟡 Internet with packet loss since 19:30 (15 min)
Probable cause: your provider, beyond the modem (high confidence).
• 16 of 23 destinations lost packets; never all at once
• your router answered normally (10%, its usual 10%)
• this Pi's Wi-Fi was stable (-50 dBm, no cuts)
See 19:25–19:45 → http://smoking-pi.local:3000/d/smoking-pi-overview-v1?from=…&to=…
With one Netflix cache losing 30% meanwhile, the contrary signal says so:
Against: Netflix alone lost 30%. Its end, after 23:00, silent:
✅ Packet loss over after 3h 30m (19:30 to 23:00)
Cause: your provider, beyond the modem (high confidence).
Affected: 16 of 23 destinations.
The line down (invented: 10:00-10:20, the router with it), at 10:15, and its end:
🔴 Internet down since 10:00 (15 min)
Probable cause: your line, the modem or the line to your provider (high confidence).
• all 23 destinations lost every packet
• your router stopped answering too
• this Pi's Wi-Fi was stable (-50 dBm, no cuts)
✅ Internet back after 20 min down (10:00 to 10:20)
Cause: your line, the modem or the line to your provider (high confidence).
Affected: all 23 destinations.
When the reading changed after the first message, the end says so: Cause: your line, … (high confidence). This corrects the first message, which said your provider, beyond the modem. An update is one line: 🔁 Update on the packet loss since 19:30: now the Internet is down.
The radio deaf for 17 minutes on 18 October, and the watchdog reloading its driver (the monitor's own message, silent, once it measures again):
🛠 This Pi could not measure the network from 14:05 to 14:27 (22 min)
Cause: this Pi's Wi-Fi radio stopped receiving (high confidence).
The watchdog reloaded the Wi-Fi driver at 14:22.
What the network did meanwhile is unknown.
An episode that began and ended in quiet hours is one line of their morning summary (and an undelivered one, of the outbox's):
🌙 Quiet hours, 02:55 to 07:00 — held overnight:
🟢 Nothing open now.
🔴 Internet down · 02:00 → ✅ 02:40 — probable cause: your line, the modem or the line to your provider
What is recorded and not pushed has its line in the notification ledger, in the same words -- the 40-second cut of 15 October:
📝 Recorded, not sent (under a minute): Your line cut out for 40 s, 12:35 to 12:40
Cause: your line, the modem or the line to your provider
A webhook receiver gets the same text, plain, in message, and the episode's
record in episode with its kind (down, degradation, update,
recovery, monitor, night).
What is material
An episode is material when all five hold, judged on the minutes the monitor could hear:
| Condition | Threshold (constant in common/definitions.py) |
|---|---|
| Measurable | Something heard outside the monitor's deaf spans, upgrade windows and watchdog actions, with one probe cycle of margin |
| Breadth | MATERIAL_BREADTH_PCT (30 %) of the reporting destinations lost in the same cycle, or MATERIAL_MIN_CATEGORIES (2) categories each with MATERIAL_CATEGORY_SHARE (50 %) of its own destinations lost -- one site in each of two categories (a university's web server and its name server) is still one site |
| Persistence | MATERIAL_MIN_MINUTES (15) of consecutive broad cycles -- three 5-minute cycles -- or MATERIAL_MIN_EPISODES (2) broad episodes within MATERIAL_EPISODES_WINDOW_S (an hour) |
| Magnitude | Mean loss over every reporting destination, across the broad cycles, at least MATERIAL_LOSS_PCT (5 %); or median latency at least MATERIAL_LATENCY_RATIO (2×) the same hours a week before. No rule measures latency against last week yet: the condition is in the gate, and nothing feeds it |
| Novelty | Not explained by an open episode (its consequences join it) or a known pattern: an episode of a recurring window's class in its hours is recorded as part of it (unmet: ["novelty"], pattern: <id>), not pushed, its end included. An episode outside every window's hours is judged as before |
These are constants, not settings, on purpose: the alerter, the weekly summary and the MCP tools must agree on what was material, and a per-install knob would split them. The rule windows and thresholds that make the signals (below) stay tunable.
Recurring patterns
From 2026-08-30 to 2026-10-06 most destinations on the reference Pi lost 2-8 % of their pings from 19:30 to 23:00 every evening -- the provider at peak hour, 38 evenings. No message named it: none on 10-01...10-05, then 12 per-destination ones on 10-06. With the episodes alone each evening would have been its own alert, the 38th as loud as the first. A window that comes back is one fact, said once when it appears and once when it is gone (decision of 2026-10-30); in between, the weekly summary counts it.
What makes one (common/patterns.py, shared by the alerter, the
weekly summary and the MCP server): the closed episodes of the last 7 days
that are material in everything but novelty, of a network class
(upstream, local_link, destination; never the monitor's own), and
whose loss spans fall in the same band -- the span in DIGEST_TZ,
widened to the half hour, an episode in it when at least 50 % of its span
is -- on at least 3 of those days (RECURRING_MIN_DAYS). The band is the
members' median start and end; a band past midnight belongs to the day it
starts. Its id is band and class, 1930-2300-upstream.
Only what the monitor heard counts, either way. Each cycle the alerter could judge marks its half hour heard. A day whose band was heard for less than half its length -- the radio deaf, the Pi off, the database unreadable, before the record began -- is blind for that pattern: neither a day seen nor a day without it. So a pattern cannot form from days nobody measured, nor end because of them.
What it says, both silent, at most one such message a day (a second waits for the next day):
| When | Message |
|---|---|
| A band reaches 3 days -- on the third evening, at the minute it would have been alerted | the window, its probable cause and its evidence, in the episodes' words (below), with the last occurrence in the Connection quality dashboard when links are configured |
| 3 observed days in a row without it | ✅ The evening packet loss (19:30 to 23:00) did not come back for 3 days; last seen Tuesday. It was there on 9 of 12 evenings while it lasted. |
🔁 For the 3rd evening in a row, packet loss on most destinations from 19:30 to 23:00.
Probable cause: your provider, beyond the modem, at peak hour (high confidence).
• 3 of the last 3 evenings
• 14 of 18 destinations lost packets, 5–6%
This is evidence you can show your provider.
In between, its episodes are recorded, never pushed (smoking-pi alerts
history shows each as recorded with part of a recurring loss window,
already told; the record keeps the pattern id), and its counters advance. The weekly summary's
Recurring section reads the pattern objects -- 19:30–23:00: packet
loss on most destinations, 5 evenings of 7 (your provider; 17 evenings of
21 since 28 Sep) -- and says a pattern gone that week once. MCP
list_alert_state lists them (patterns: hours, state new / active
/ gone, days seen of days observed, typical breadth and loss, evidence
episode keys), so an assistant can answer "is this normal for this hour?".
Only the usual evening. An episode in the hours is part of the pattern
only at its usual size: loss at most twice its worst (or 5 points above
it) and breadth at most 30 points above its typical. A real failure at
21:00 inside the window -- 60 % loss on everything -- is news and is
alerted as any other. The band is matched in the zone it was drawn in, so
changing DIGEST_TZ does not shift it. mute_alerts(rule="pattern")
silences the two messages. A pattern is of one class: evenings the
diagnosis calls alternately your provider and your line make two
half-patterns that may never reach 3 days each (a known limitation).
The inference's shared degradation periods (profile inference) are
supporting evidence only: counted on a new pattern (inference_days) when
they can be read, never needed for one. An Internet down inside a
pattern's hours is still pushed: that is never "the usual".
State: state.json["patterns"] -- at most 20 patterns, a gone one kept 30
days, 90 days of day marks each, 14 days of heard half hours.
shared/modules/alerter/tests/test_patterns.py replays 2026-09-28 ->
2026-10-09 with the window every evening to 10-06: an alert and a silent
end on 09-28 and 09-29 (two days are not a pattern), the pattern's message
on 09-30 at 19:45 instead of a third alert, nothing on 10-01...10-06 (each
recorded as part of it), its end on 10-09 after 23:00, and the weekly of
28 Sep naming it, 7 evenings of 7.
Quiet hours
Between QUIET_FROM and QUIET_UNTIL nothing sounds, the Internet down
included:
- an episode that became material in the night and is still open when quiet hours end is alerted then, as by day -- it sounds;
- one that began and ended in the night goes, only if it was material,
into one silent message when quiet hours end, the outbox's summary
(type
held): what is open now, then each episode once; - a silent message -- the end of an episode told by day, the monitor's one message -- wakes nobody and is sent as it is.
Until front 8 a total loss and the monitor going blind passed through
(TOTAL_RULES, MONITOR_RULES); now nothing does. The outbox is not held:
a notification already late because delivery failed goes as soon as it can.
sudo smoking-pi alerts --quiet 23:00-07:00
sudo smoking-pi alerts --quiet off
The times are in the digest's zone (DIGEST_TZ, then TZ, then UTC), and
a span may cross midnight. Both are checked before anything is written.
Quiet hours are off while either value is empty or unreadable; the alerter
logs a warning. Turning them off sends what was held on the next cycle.
MCP list_alert_state shows what is waiting (held: how many, since when,
until when), so an assistant asked at 4 a.m. does not answer "all quiet".
| Variable | Default | Meaning |
|---|---|---|
QUIET_FROM |
(unset) | HH:MM when quiet hours begin |
QUIET_UNTIL |
(unset) | HH:MM when they end and the held message goes out |
Tested against October
shared/modules/alerter/tests/test_october.py rebuilds the audited facts as
the measurements the Pi wrote -- loss per 300 s step, the 10 s first-hop
probe, the Wi-Fi exporter's deaf samples, host_uplink's route changes, the
watchdog's events -- and replays them minute by minute through the real
cycle, asserting the exact messages:
| Day | What happened | Before | Now |
|---|---|---|---|
| 10-09 21:21 | The Pi lost its default route for 30 s | a microcut alert, "the line to the ISP", and its recovery | nothing; recorded, this Pi |
| 10-11 03:40-14:35 | Radio deaf 11 h | outage, uplink_down, re-notifications, recoveries | one silent This Pi could not measure the network at 14:35 |
| 10-12 10:10-16:00 | Radio deaf 5 h 40 min, the exporter stalled, a reconnection cut | three outages, exporter_stale, two recoveries, a microcut "just that site" | one silent This Pi could not measure the network |
| 10-14 | Netflix_5 10 min; UBA 10 + 15 min | four high_loss alerts and recoveries |
nothing; recorded, just that site |
| 10-15 12:35 | A real 40 s cut of the line, 12 destinations | a microcut alert and its recovery | nothing; recorded as a line microcut, your line |
| 10-18, 10-28 | Deaf 15-20 min, the watchdog reloaded the driver | four to six messages each | one silent This Pi could not measure the network each |
| 10-06 19:30-23:00 | Most destinations losing 2-8 %, the first hop clean | nothing (no rule saw it) | Internet with packet loss at 19:45, your provider, beyond the modem; a silent Packet loss over after 23:00 with 3h 30m |
| invented | The line down 20 min | Internet down at 15 min; a silent Internet back with 20 min |
Signals: the rules
Every rule below finds something in the last minutes of measurements and
produces a signal: its kind, the targets, the span its evidence covers
(start-end), and its reading. A signal is never a message of its
own; it joins the open episode. The detection of each is unchanged by front
8, except that outage has one key whatever its age (it used to be keyed
per 5-minute bucket, and one cut became three outages) and degradation is
new.
| Rule | Severity | Condition | Tunables (default) |
|---|---|---|---|
uplink_down |
critical | Most targets (WIDESPREAD_PCT of those reporting) at 100% loss in each of the latest 3 probe cycles, consecutive in time (one absent cycle tolerated), and the first hop (the ISP gateway, category cpe) lost too — the monitor's own uplink is gone. With no first-hop measurement it says the two cannot be told apart. The first hop never counts in the breadth: it is evidence, not a destination. ONE incident; the per-target ones it would fan out into are not sent |
WIDESPREAD_PCT (80 %), DOWN_WINDOW |
internet_down |
critical | The same total loss while the first hop answers: the Internet beyond the house is down, not this host or the line. Before, this read "this host's uplink is down". Verdict isp_upstream |
as uplink_down |
monitor_dns |
critical | Every named destination at 100% for the same 3 cycles while the first hop and the DNS resolvers queried by address (dns_latency) answer: this host cannot resolve names (its own DNS; 2026-08: a frozen resolv.conf), the network is fine. Verdict monitoring |
as uplink_down |
outage |
warning | A run of probe cycles in which most targets lost at least WIDESPREAD_LOSS_PCT at once. One key, outage, with since its first cycle -- and the first cycle of the outage it continues once that has slid out of the window, so a long one keeps its start. An older run still in the window rides quiet, as does the tail of an uplink_down (lost cycles still in the window after the uplink returned): both keep the episode's evidence and suppress the per-target signals |
WIDESPREAD_PCT (80 %), WIDESPREAD_LOSS_PCT (30 %) |
degradation |
warning | New in front 8: the newest probe cycle (or the one before) lost something on MATERIAL_BREADTH_PCT (30 %) of the reporting destinations, or on half of the destinations of MATERIAL_MIN_CATEGORIES (2) categories, with a mean loss over every reporting destination of at least MATERIAL_LOSS_PCT (5 %). A provider dropping 2-8 % on most destinations every evening reaches neither high_loss (one target over 20 %) nor outage (most over 30 % in one cycle), and was never reported (the reference Pi, 30/08-06/10/2026, 19:30-23:00). Not while anything widespread is active |
the material thresholds below (constants) |
target_down |
critical | ALL loss points for a target (latency + dns_latency) in the last window are >= 99.9% loss, with at least 3 points. Not sent while anything widespread is active |
DOWN_WINDOW (1200 s) |
high_loss |
warning | Mean loss for a target over 15 min exceeds the threshold and the loss persisted: at least HIGH_LOSS_MIN_POINTS probe cycles that lost two or more pings (see Probe cadence) within the same 15 minutes the mean covers. Targets already down are excluded; not sent while anything widespread is active |
HIGH_LOSS_PCT (20 %), HIGH_LOSS_MIN_POINTS (2) |
microcut_burst |
warning | Per target+protocol in cpe_latency, over the last 60 min: a confirmed cut — a run of two or more consecutive 10 s windows above MICROCUT_LOSS_PCT, or one window at 100% — or MICROCUT_BURST_N possible cuts (isolated single windows at 51–99%). The message names the cut and its duration ("1 cut of 2 min 40 s (6 windows, all at 100%)"). Definitions in common/microcuts.py, shared with the MCP tool, the weekly summary and the AI report |
MICROCUT_BURST_N (3), MICROCUT_LOSS_PCT (50 %) |
exporter_stale |
critical | Zero latency points written in the last window (global — the RRD exporter is probably stalled). Not while the bucket holds no latency point at all: a new install has none before its first step, and has not stalled. An incident already open stays open |
STALE_WINDOW (1200 s) |
measurement_stale |
warning | One of the other writers stopped: no dns_latency, http_latency, tcp_latency, cpe_latency (gateway microcut probe) or wifi_link point in the window (or in four of that measurement's own steps, when longer), though it wrote within the last 24 hours. A host that never had one (wired: no wifi_link) is not expected to. Not while exporter_stale is open: that is one stall, one message. A writer silent for more than 24 hours is taken as removed on purpose (an Ethernet uplink, a disabled probe) and the incident is retired without a recovery; mute it to stop it sooner. Without it, a stopped microcut probe or Wi-Fi exporter silently took the evidence the diagnosis reads |
STALE_WINDOW (1200 s) |
influx_unreadable |
critical | The alerter could not read InfluxDB for five minutes: no rule ran. The whole unreadable spell is a database blind span of the episode, and every open signal record is held as it was until the database answers again; it counts as readable after three good cycles in a row. For one stale window after that, a new exporter_stale or measurement_stale is not raised: the writers could not write meanwhile. The weekly summary, the AI reports and the incident history are skipped while blind (each reads InfluxDB). The dead-man check-in reports it outside at once |
— |
evaluation_failed |
critical | The same blindness from a bug in the alerter's own rules rather than the database (any exception that is not a connection or InfluxDB client error). Treated as influx_unreadable is; the traceback is in the alerter's log |
— |
watchdog |
info / warning | What smoking-pi watchdog did on the host, read from watchdog_event in InfluxDB: a driver reload, a reboot, a SmokePing restart (an action: one probe cycle after it is a watchdog blind span), the network back (info); an action it could not take or a SmokePing crash loop (warning). Each event once; the first look after an upgrade skips older ones. See watchdog.md |
— |
ipv6_down |
warning | Every IPv6 target (name ends in 6, or an fping6-ish category) at 100% loss for 15 min while at least one IPv4 target is healthy; emits ONE aggregate incident |
— |
Loss semantics match the exporters: latency/dns_latency loss is a 0-1
ratio (legacy packet counts 0..20 are clamped), cpe_latency loss is a
percent 0-100.
Why the widespread rules exist. On the reference Pi the Wi-Fi radio hung
twice in September 2026 — associated to the access point at −49 dBm, uplink
flag set, and not one packet received for 3 h 20 min (and, earlier, 21 h).
Every target went to 100% including the LAN gateway, and the alerter sent 18
target_down criticals plus 18 high_loss warnings, re-sent at every
cooldown: about 110 messages for one fact. A 3-minute blink on 2026-09-19 did
the same in miniature — every target got one bad cycle, every 15-minute mean
cleared 20%, and 18 warnings plus 18 recoveries went out for a link that
blinked. Both shapes became one incident, and since front 8 one episode.
The evidence and the numbers behind the
thresholds are in detection-reliability.md.
Which targets count in the breadth. Every ICMP and DNS resolver target
counts and can also alert on its own. The HTTP and TCP probes and the DNS
wizard's adopted services (every protocol) count in the breadth only: they
never raise a target_down or high_loss, but they are in the share that
makes outage, uplink_down, internet_down and monitor_dns, and in
the diagnosis's count. Before, the breadth was the ICMP and resolver targets
alone, 19 of 247 on the reference Pi, so a handful of sites losing packets
read as "the link". A breadth-only target counts in a window only when at
least half of its points in that window were clean (under one and a half
lost pings): a CDN that drops ICMP sits at 100% forever, and a path that
blocks HTTP/3 half the time is lossy all day; either would otherwise be in
every cycle's share. One on a slower step than the rules' bucket does not
count: it would report in one cycle of two. monitor_dns needs
WIDESPREAD_PCT of the named targets lost, not every one.
The diagnosis attached to an alert, the incident history, and the MCP
diagnose_loss and get_loss_events count breadth-only targets by the
same rule (common/breadth.py), so an alert's "14 of 16" and its
diagnosis's agree. One difference: the alerter takes the vote over its own
window (20 minutes), they take it over theirs (hours to a week). A target
lossy for most of the week does not vote in a week's diagnosis, even in a
cycle where the alerter counted it; at the moment an alert fires, the two
sets are the same unless a target was lossy for most of the diagnosis
window. Over those windows only queries InfluxDB answers from its storage
engine are asked -- points per target, points at or above the event bar,
each target's first and last point, and per cycle how many voters were
lossy and how many lost everything -- and the cycles are put together in
Python. On the reference Pi (224 breadth-only targets) that is about 3 s
for a day and 16 s for a week; every query answers one row per target or
per cycle, however long an outage. A target reports in every cycle from its
first point to its last, so a gap of a few cycles counts as reporting. The
breadth is counted over a week at most: a longer get_loss_events counts
the ICMP and resolver targets alone. breadth_only: false (in
diagnose_loss's coverage) means the breadth was not counted for any
reason: a longer window, a failed query, or no target voting. The alerter's
and the MCP server's logs say which. The few breadth-only targets that lose
a point in any cycle count only once a cycle is broad: beside one named
site's miss they are background. Breadth-only targets are counts there and
nothing else: an incident's targets, the one-or-two-sites destination
class and every per-target list are the ICMP and resolver targets. A cut of
the web services alone, every ping answering, is an incident with no
targets.
Signal bookkeeping
State lives in a JSON file (ALERT_STATE_FILE, default
/var/lib/alerter/state.json on the alerter-state volume; falls back to
/tmp/alerter-state.json if unwritable). Writes are atomic. Besides the
episodes, it keeps one record per active signal key (incidents), which
the rules read back between cycles and list_alert_state shows. None of
this notifies (state.track):
- First seen → recorded (
first_seen,last_seen). - Gone → a grace period (
missing_since); dropped afterALERT_RESOLVE_AFTER. Reappearing inside it is the same signal. - No data is not an end. A record about a target that no longer has
enough points to judge (three in the down window) is held
(
held_since): a stalled probe, the exporter itself, a renamed or removed target.uplink_down,internet_down,monitor_dnsandoutageare held when no target has data at all. Dropped after 24 hours with no data. - Worse replaces milder.
target_downsupersedes thehigh_lossit grew out of, and the three total-loss signals supersede one another when the reading changes mid-outage (the gateway reboots, or comes back before the ISP does). - Quiet signals (an older outage run, the tail of an
uplink_down) are never recorded; a tail keeps the record it continues from ending.
Notifier modes (NOTIFY_MODE)
The short way (Pro), straight to Telegram with a bot of your own:
sudo smoking-pi alerts --telegram
It explains how to make the bot (in Telegram, @BotFather, then /newbot)
and asks for the bot's token, hidden as you type. Then it asks you to send
the bot any message and reads your chat id from it, so there is nothing to
look up. It counts only a message sent after it asked, shows whose message
it was, and asks before using that chat.
A bot that OpenClaw (or anything else) already uses: give the chat
yourself, with --to CHAT_ID. If OpenClaw is set up, OPENCLAW_TO is
telegram:CHAT_ID. Finding the chat reads the bot's incoming messages,
which Telegram allows one program at a time and marks as read, so the
other program could lose a message. If the bot has a webhook set, finding
the chat fails outright. The command asks about this before reading. Sending alerts through a shared bot is
fine. Alerts sent this way do not enter OpenClaw's conversation, though,
so the assistant does not know about them. A bot only for alerts keeps them
apart. The steps after that are the same as for OpenClaw below: the
alerts profile, the alerter's preflight, and an optional --test. No
OpenClaw needed. With OpenClaw on the Pi instead:
sudo smoking-pi alerts --openclaw --to telegram:<your chat id>
This sets NOTIFY_MODE and the keys below. It takes the gateway token from
your ~/.openclaw/openclaw.json when there is one, turns on the alerts
profile, recreates the alerter, and prints the alerter's own delivery
preflight: reachable, a rejected token, or the message tool filtered out
by policy. Add --test to send one labeled message. The preflight shows the
gateway would accept a send, not that the recipient is right; a message
arriving is the only proof. --webhook (the URL typed at a prompt or piped on stdin: it is often
the credential itself) and --off work the same way.
Run it with no options to be asked.
Messages are an episode's: a head (🔴 Internet down, 🟡 Internet with packet loss, ✅ Internet back, 🛠 This Pi could not measure), then its probable cause, its signals and a link to its range -- composed to fit the channel's budget. See One episode, one message and Message rendering below.
off (default)
Log-only. Rules are still evaluated and incidents logged, so you can watch
docker compose logs alerter before wiring up delivery.
telegram
Sends straight to the Telegram Bot API with your own bot, no gateway in
between: sendMessage, or sendPhoto with the message as the caption when
there is a chart (sendDocument with ALERT_IMAGE_AS_DOCUMENT=true). The
text is the same Telegram HTML the OpenClaw path sends. Link previews are
off, because the links point at this house's Grafana. The weekly summary
is sent silently.
NOTIFY_MODE=telegram
TELEGRAM_BOT_TOKEN=<from @BotFather>
TELEGRAM_CHAT_ID=<your chat id; -100... for a group>
- The token is part of every Bot API URL (
/bot<token>/sendMessage), so the alerter never logs a URL or an exception's text. A failure is logged as the method, the HTTP status and Telegram's own description. httpx's own request log, which names every URL, is turned down to warnings, and a filter on it replaces the token with<redacted>in case that log is turned up again. - A bot can write only to someone who wrote to it first. The preflight
checks both halves at start:
getMe(is the token a bot's?) andgetChat(can it reach the chat?). The usual failure ischat not foundbecause nobody has messaged the bot yet. - A 4xx is the request's fault (a wrong chat, a blocked bot) and is not retried. A 429 waits as long as Telegram asks, up to 30 s, and a 5xx or no answer is retried three times. A retry after no answer can deliver the same alert twice, because Telegram may have sent the first one. As with OpenClaw, a chart that fails to send never costs the alert: it is retried as text. If Telegram cannot parse the message's HTML, the same words are sent once more without markup.
sudo smoking-pi config set TELEGRAM_BOT_TOKENreplaces the token, read from a prompt or stdin, never the command line.
openclaw
Invokes OpenClaw's message tool over the Gateway's HTTP endpoint,
POST {OPENCLAW_URL}/tools/invoke, with
Authorization: Bearer {OPENCLAW_GATEWAY_TOKEN} and body:
{
"name": "message",
"args": {
"action": "send",
"channel": "telegram",
"to": "telegram:123456789",
"message": "🔴 <b>critical</b> — <target>\n🌐 Not you — 12 of 16 ..."
}
}
/tools/invoke is always enabled on a stock gateway and is multiplexed onto
the same port as the WebSocket protocol. It is gated by Gateway auth plus
tool policy — so the message tool must also be permitted by
tools.allow in openclaw.json.
Example .env values:
NOTIFY_MODE=openclaw
OPENCLAW_URL=http://127.0.0.1:18789
OPENCLAW_GATEWAY_TOKEN=<gateway.auth.token from ~/.openclaw/openclaw.json>
OPENCLAW_CHANNEL=telegram
OPENCLAW_TO=telegram:<your-chat-id>
Find your recipient with openclaw gateway call sessions-list and read
deliveryContext.to.
The alerter runs with network_mode: host, so the loopback default reaches
the gateway with no extra plumbing.
Earlier versions of this document said a stock gateway serves no HTTP at all. That was wrong. It came from probing
/hooks/agent— a path that exists on no OpenClaw build — getting a 404, and generalising from one missing route to the whole surface./tools/invoke,/v1/*and the other documented HTTP APIs were there the entire time.
Two failure modes are specific to this endpoint, and the alerter checks for both at startup:
- It answers HTTP 200 with
{"ok": false}when the tool itself fails. Trusting the status code alone would count a refused send as a delivered alert, so the body is inspected. A failure is not sent again, by any path: once the gateway has the request it holds the message in its own durable delivery queue and replays it when it can, and each new attempt was one more copy (2026-10-09: six of one alert in one second). The same goes for a request it received and did not answer within the 10 s timeout, and for an HTTP 500. Only a request that never reached it (the connection refused, a request not written whole, or a proxy in front of a remote gateway answering 502, 503 or 504) waits in the outbox for another try; only one it refused outright (HTTP 4xx) gets the text-only retry a refused chart gets. - It answers
Tool not available: messagewhen tool policy filters the tool out, rather than when it is missing. The preflight distinguishes that from a bad token (401) and an unreachable gateway.
A healthy preflight logs:
INFO alerter.notifier: Delivery preflight: http://127.0.0.1:18789/tools/invoke
reachable, 'message' tool permitted (HTTP 200)
Use telegram mode above, or webhook below, if you want something with no OpenClaw version
dependency. Full recipe, including MCP registration:
docs/openclaw-integration.md.
webhook
POSTs JSON to ALERT_WEBHOOK_URL, optionally with
Authorization: Bearer {ALERT_WEBHOOK_TOKEN}:
{
"type": "alert",
"rule": "episode",
"kind": "degradation",
"severity": "warning",
"target": null,
"message": "🟡 Internet with packet loss since 19:30 (15 min)\nProbable cause: your provider, beyond the modem (high confidence).\n...",
"episode": {"key": "episode:12", "class": "upstream", "cause": "...",
"confidence": "high", "start": 0, "end": 0, "material": true},
"state": {"first_seen": 0, "notified_count": 1},
"ts": "2026-01-01T00:00:00+00:00"
}
type is alert, recovery, report, weekly, held or undelivered
(see below); kind and episode come with an episode's message.
Delivery (both HTTP modes): 10 s timeout. The webhook gets 3 attempts with exponential backoff; the OpenClaw gateway gets one request per message, and the outbox tries again next cycle when that request never reached it. Failures are logged, never crash the loop.
When delivery fails: the outbox
An alert or recovery that cannot be delivered is kept in the state file's outbox, not dropped. While anything waits there:
- new alerts and recoveries join it instead of being sent into a dead link (no chart: a summary has none);
- once a minute at first, doubling to every 10 minutes, the alerter checks
whether delivery could leave the house (a TCP connect to
api.telegram.org:443for Telegram, the webhook's host, or1.1.1.1:443for another OpenClaw channel) and tries only then; - what it delivers is one message: a single notification younger than
10 minutes as it was, otherwise a summary, type
undelivered, of the whole stretch: what is open now, then each incident once, when it started, whether it recovered ((over)when it ended without one, as a briefoutagedoes); - if the receiver refuses the summary three times while the network is up (a revoked token, or text it rejects), a plain fallback with only counts and rule names goes instead, so a summary that cannot be sent never holds later alerts behind it for good.
The outbox holds at most 100 notifications (the oldest go first, and the
summary counts them). list_alert_state shows what is waiting
(undelivered), and each notification's payload carries its
delivery: sent, queued (in the outbox), handed (to the OpenClaw
gateway) or held.
Before, a failed alert waited for the next hourly cooldown, a failed
outage was never retried, and a failed recovery was lost. During the
reference Pi's 11-hour radio hang on 2026-10-11 every alert failed, and
nothing afterwards said what had happened.
One limit remains: the state file is written once per cycle, after the sends. A crash between a send and that write sends it again on restart.
Said once: what delivery guarantees
Every alert, re-notification and recovery has an idempotency key: the
incident (its key and when it was first seen) and the kind of message (the
first alert, the n-th hourly re-notification, the recovery). The state file
records, for seven days, what became of each: sent; queued, when the
OpenClaw gateway answered or may have received it, and delivers it from its
own queue; told, by an outbox or quiet-hours summary; held; or waiting
in the outbox. A key that was sent, queued or told is never handed to a
transport again, whether a direct send, an outbox resend or the end of
quiet hours tries it. A summary that is delivered marks everything it
carries as told, and drops what still waits elsewhere about the same
incident and kind: an outbox summary during quiet hours takes the held
re-notification of the same alert with it. A recovery is its own kind: an
incident told only in a summary still recovers, once.
A message the gateway answered with a failure keeps the outbox shut until the next check finds delivery reachable, so what follows meanwhile waits there and arrives as one summary; it is neither resent nor listed in that summary: the gateway delivers it. The daily report counts the same way. If the gateway drops a message it answered with a failure, the alerter does not know; the next summary's "Now open" line still shows the incident while it is open.
Before (2026-10-18 and 10-28), an outage alert that opened the outbox had
two copies in the gateway (the attempt that timed out, and the retry it
answered with ok: false): the outbox summary told the outage, and 4 to 5
minutes later the gateway replayed both copies, identical, one minute
apart. A send the gateway delivered but answered with a failure was also
sent again by the outbox a minute later, as it was.
Times in messages
Every time the alerter prints is in one zone: DIGEST_TZ, which
smoking-pi alerts --digest-tz America/Chicago sets, falling back to TZ
and then UTC exactly as the weekly summary's schedule and quiet hours do.
That covers alerts and recoveries, the "not delivered" summary, the
quiet-hours message, the watchdog's actions and the weekly summary. A time
today reads 20:40; any other day carries its date, 28 Oct 20:40 (the
weekly summary adds the weekday: Wed 28 Oct 20:40). When DIGEST_TZ is
unset or not a zone, the zone in use is named after the time (01:40 UTC),
since nobody chose it; an unknown name is logged once. No time is read from
the process's local zone, and what is stored (the state file, InfluxDB)
stays in UTC.
sudo smoking-pi alerts --digest-tz America/Chicago
When this host goes silent: the dead man's switch
Every alert comes from the host being watched. When it hangs, loses power or its SD card, the alerts stop, and silence reads as "all well". A check-in service closes that gap from outside: the alerter checks in with it, and the service alerts you when the check-ins stop. Because it runs off this host, it is the one alert that still works when the whole house is down.
- On healthchecks.io (free; or a self-hosted Healthchecks), add a check with a period of 5 minutes and a grace of 10, and connect it to where you want the alert (email, Telegram).
- Give the alerter its ping URL, which is read hidden (or from stdin) because it is a credential:
sudo smoking-pi alerts --deadman
The command waits for the alerter's first check-in and prints its log line, which names the host and never the URL. 3. Pause the check once in the service to see its alert reach you.
What the alerter sends:
- After every evaluation that ran, a GET to the URL: alive, and judging.
- Once it has been unable to read InfluxDB for 5 minutes (when its own
influx_unreadable alert fires), a GET to URL/fail: alive, and blind.
The service reports that at once instead of after its grace period. A
shorter blindness, such as an InfluxDB restart during an upgrade or a
backup, sends nothing and is covered by the grace period.
- At most one check-in every 5 minutes, one right away when that state
changes, and never two tries within a minute. A failed check-in is
retried a minute later. That is about 300 requests a day, roughly a
megabyte, against the usage budget.
It covers the alerter being alive and judging. It does not cover
delivery: a revoked bot token is the outbox's to report, not this
switch's. An alerter that crashes before the end of an iteration does not
check in, which is the point. With ALERT_INTERVAL above 5 minutes it
checks in once per iteration, so set the check's period to match.
sudo smoking-pi alerts --deadman off turns it off.
| Variable | Default | Meaning |
|---|---|---|
ALERT_DEADMAN_URL |
(unset) | The check-in URL; empty = off. A secret |
Daily report delivery
If the ai-insights service (profile ai) is writing Markdown reports to
the shared reports volume, the alerter delivers the newest report-*.md
through the same notifier — at most one per REPORT_DELIVERY_INTERVAL
(default 86400 s), prefixed with Daily network health report: and trimmed to
REPORT_MAX_CHARS (default 3500, Telegram-friendly). The limit bounds the
whole message including that header, and trims on a line boundary. A
missing reports directory is skipped quietly.
Environment reference
| Variable | Default | Purpose |
|---|---|---|
NOTIFY_MODE |
off |
off, telegram, openclaw, or webhook |
TELEGRAM_BOT_TOKEN |
— | Your bot's token from @BotFather (telegram mode) |
TELEGRAM_CHAT_ID |
— | The chat it writes to; alerts --telegram finds it |
OPENCLAW_URL |
http://127.0.0.1:18789 |
OpenClaw gateway base URL |
OPENCLAW_HOOK_PATH |
/tools/invoke |
Path appended to OPENCLAW_URL; override only for a proxy or bridge |
OPENCLAW_GATEWAY_TOKEN |
— | Gateway token (gateway.auth.token in openclaw.json) |
OPENCLAW_HOOK_TOKEN |
— | Legacy alias for the above; OPENCLAW_GATEWAY_TOKEN wins |
OPENCLAW_CHANNEL |
telegram |
Delivery channel |
OPENCLAW_TO |
— | Recipient in OpenClaw's address form, e.g. telegram:123456789 — a bare chat id will not deliver. Find it with openclaw gateway call sessions-list |
ALERT_WEBHOOK_URL |
— | Generic webhook endpoint |
ALERT_WEBHOOK_TOKEN |
— | Optional bearer token for the webhook |
ALERT_INTERVAL |
60 |
Seconds between evaluations |
ALERT_RESOLVE_AFTER |
900 |
Seconds without evidence before an episode closes (and its end is told, if it was told at all), and a signal record is dropped. Never less than three steps of the slowest probe |
ALERT_MAX_PER_HOUR |
6 |
Hard ceiling on alerts and updates per rolling hour, across every episode: a blast-radius limit, unreachable when the policy works; 0 disables |
ALERT_STATE_FILE |
/var/lib/alerter/state.json |
Episodes, signal records, outbox, quiet-hours box (atomic writes) |
DOWN_WINDOW |
1200 |
target_down window (seconds). SmokePing probes on a 300 s step by default and DOWN_MIN_POINTS is 3, so this must span strictly more than 3 steps — at exactly 3 the rule stops matching whenever jitter costs it one point, and the incident flaps. See Flap damping. A probe on a slower step raises it to four of that probe's steps by itself (see Probe cadence) |
STALE_WINDOW |
1200 |
exporter_stale window (seconds); same step arithmetic as DOWN_WINDOW, raised the same way |
HIGH_LOSS_PCT |
20 |
high_loss threshold (percent) |
HIGH_LOSS_MIN_POINTS |
2 |
Probe cycles with two or more lost pings (15% on a 10-ping probe) that high_loss needs within the mean's own 15 minutes (the latest three cycles of the down window, so a cycle that aged out of the mean cannot corroborate a new one). One bad cycle can average over HIGH_LOSS_PCT on its own, and one cycle is a blink |
WIDESPREAD_PCT |
80 |
Share of the reporting targets (the first hop excluded) that must be lossy in the same probe cycle for outage, or at 100% for uplink_down/internet_down. monitor_dns is judged on the named targets alone |
WIDESPREAD_LOSS_PCT |
30 |
Loss percent a point needs to count toward outage — above the single-lost-ping background. A point must also have lost two or more pings, so a probe sending few pings cannot reach it on one lost ping, however low this is set |
MICROCUT_BURST_N |
3 |
Possible cuts (isolated single windows above the threshold) per 60 min to flag a burst when there is no confirmed cut. Windows are ~30 s apart (CPE_PROBE_WINDOW + CPE_PROBE_IDLE); "consecutive" tolerates one missing window (common/microcuts.py GAP_S), rescale it if you change CPE_PROBE_IDLE |
MICROCUT_LOSS_PCT |
50 |
Loss percent above which a 10 s CPE window counts as a microcut. CPE gateways rate-limit ICMP, giving a constant single-digit loss floor, so counting any loss at all would flag that floor permanently |
REPORTS_DIR |
/reports |
Where ai-insights reports are read from |
REPORT_DELIVERY_INTERVAL |
86400 |
Min seconds between report deliveries |
REPORT_MAX_CHARS |
3500 |
Truncation limit for a delivered report, including the header — it bounds the whole message, since that is what the channel budget applies to |
ALERT_MARKUP |
html |
html (Telegram's parse mode) or plain |
CHART_THEME |
light |
light or dark. A static image cannot follow the reader's theme, so one is chosen. Light is a paper-style figure: white, large type, sized to stay legible on a phone |
CHART_MAX_BYTES |
700000 |
Cap before a chart is dropped rather than shrunk further (must stay inside the gateway's 2 MB invoke body once base64-encoded) |
ALERT_IMAGE_AS_DOCUMENT |
false |
Send images as documents (a file card to tap open) instead of inline photos. Telegram re-encodes photos as JPEG; the charts are drawn large enough for that, so inline is the default |
ALERT_SILENT |
false |
Deliver without a notification buzz |
ALERT_DIAGNOSIS_HOURS |
3 |
Hours diagnosed when an episode is alerted; its reading rides under the episode's own cause (see The diagnosis). 0 turns it off |
INCIDENT_HISTORY_HOURS |
12 |
Window the alerter diagnoses every half hour to write down the loss incidents that are over (see Incident history); widened automatically for a longer incident. 0 turns it off |
VERDICT_BROAD_PCT |
60 |
Share of destinations at which the diagnosis (diagnose_loss, the incident history) calls damage broad. Materiality has its own fixed thresholds |
WIFI_WEAK_DBM |
-75 |
Wi-Fi uplink signal below which a sample counts as weak (the diagnosis; also what get_wifi_stats reports against) |
WIFI_WEAK_SAMPLES |
6 |
Weak samples before a cutting first hop is called the Wi-Fi in the diagnosis; rescale with WIFI_SAMPLE_INTERVAL |
ALERT_MUTES_FILE |
/var/lib/alerter-mutes/mutes.json |
Suppression windows. Written by mcp-server, read-only here — see Muting |
INFLUX_URL |
http://localhost:8086 |
InfluxDB (host network namespace) |
INFLUX_TOKEN / INFLUX_ORG / INFLUX_BUCKET |
— / smokeping / smokeping |
InfluxDB auth/scope |
All keys ship EMPTY in editions/pro/.env.template; nothing
machine-specific is baked into the images or compose files.
The verdict, retired
Until front 8 every alert carried a verdict line (verdict.py: "Not you
-- 12 of 16 destinations affected but your local link is clean"), computed
per message from the last 15 minutes. It is gone with the per-rule
messages: an episode has one cause, from classify_episode, over the whole
of its heard minutes. VERDICT_MIN_TARGETS, VERDICT_IMPAIRED_LOSS_PCT
and VERDICT_STALE_DOWN_HOURS went with it; a value left in an env file is
ignored.
The diagnosis of the last hours
When an episode is alerted (the Internet down or degraded), the alerter
also diagnoses the last ALERT_DIAGNOSIS_HOURS (default 3) exactly as the
assistants' diagnose_loss tool does (common/diagnosis_query.py), and
attaches the newest incident of a broad class -- this host's Wi-Fi, the
line, upstream -- from the last four probe steps. It never replaces the
episode's cause: at high or medium confidence, when it points elsewhere and
nothing else contradicts the episode, it is the message's contrary signal
(Against: the last hours' diagnosis points at …).
Cost: about ten InfluxDB queries over three hours, only for an alert
(a handful a month), within 20 seconds; past that, or on any failure,
the alert goes without it. ALERT_DIAGNOSIS_HOURS=0 turns it off.
Incident history
The diagnosis above is computed when it is needed, for at most a week, and nothing kept it: last month's outage could not be asked about, and no chart could mark one. The alerter now writes each loss incident down once it is over.
- When. Every half hour, in the background, so never in the way of an
alert: the last
INCIDENT_HISTORY_HOURS(12) are diagnosed and every incident that ended more than 30 minutes ago is written. One still going, or that could still change with late points, waits for the next run. - Long incidents. An incident that began before the window is cut at its edge; when it is over, the run diagnoses again with the window doubled, up to a week, until its start is inside. The reference Pi's radio was deaf for 11 hours on 2026-10-11, and a fixed 12-hour window would never have seen it whole.
- Where. InfluxDB, measurement
loss_incident, stamped at the incident's start. Every value is a field (class,detail,confidence,summary,targets,evidence,against,end_epoch,minutes,max_loss_pct...), never a tag, so a later run about the same incident overwrites it. Kept as long as the bucket keeps the measurements. - Who reads it. Assistants, through the
get_incident_historyMCP tool (up to a year); the Smoking Pi Overview and Target Detail dashboards, as a red region per incident with its class, confidence and summary on hover (Target Detail: the target's own incidents and the ones about everything).probe_missis stored but shown by neither unless asked.
It needs the alerts service, and InfluxDB: in ClickHouse mode nothing is
written. INCIDENT_HISTORY_HOURS=0 turns it off.
The notification ledger: what it told you
Until 2026-10-30 the project could not say what it had told anyone. The
digest's state["history"] kept 48 hours of bare keys, the alerter's log is
wiped by every upgrade, and the October audit of 72 Telegram messages had to
be rebuilt from the OpenClaw gateway's own message cache. Now every
notification the alerter decides on is one entry in a ledger, kept 30 days.
- What an entry holds. An
id; the incident or alertkey; thekind(alert,update,recovery,monitor— the monitor blind for 15 minutes or more —,episode— an episode that closed with nothing pushed, recorded with why —,pattern— a recurring window appearing or gone —,watchdog,outbox_summary,quiet_bundle,weekly,report;digeston entries from before the weekly replaced it); therule,severityand thetargetsit named; thetextexactly as handed to the transport (with its markup: HTML unlessALERT_MARKUPsays otherwise; one that was held or queued, as it would have read); theoutcome—sent,handed(the OpenClaw gateway has it and delivers it from its own queue),queued(joined the outbox without a try),held(quiet hours),failed(tried and not delivered: it waits in the outbox),skipped-duplicate(already said, so Said once kept it from being handed over again),recorded(the push policy decided not to send it) — with the transport'smessage_idwhen it gives one (Telegram does); when it wasdecidedanddelivered; and the diagnosisclassandcausewhen the alert carried one. - Later deliveries. When the outbox or the end of quiet hours sends one
message for everything waiting, that message is an entry of its own
(
carrieslists what it carried) and each entry it carried getsdelivered_inand its delivery time. A single notification the outbox resends as it was stays one entry, nowsent. A summary the receiver keeps refusing, or a report that keeps failing, is onefailedentry whoseattemptsgrows, not one entry per retry. - Where.
ledger.jsonl, besidestate.jsonin the alerter's state volume (written byalerter/notifications.py; Said once's per-key record isstate["delivered"], kept byalerter/ledger.py, and decides what may be sent, while this one only records what was): one JSON line per entry, a later line per change to one. A line a power cut tore is skipped by every reader. Once an hour, or past 8 MB, the file is rewritten atomically with only the last 30 days, at most 5,000 entries and 6 MB. - Who reads it. You, with
smoking-pi alerts history(below); assistants, through theget_notification_historyMCP tool and the web admin's chat.
Recording never changes what is sent or when, and a ledger that cannot be written costs nothing but its own warning in the log.
smoking-pi alerts history
One line per notification of the last seven days, oldest first: the time
in DIGEST_TZ (then TZ), the kind, the outcome
(queued→sent or held→sent when a later summary carried it; plain
sent for one the outbox resent as it was) and its first line.
--days N (1 to 30), --kind KIND and --json (every field) narrow or
widen it. The alerter reads its own ledger, so it must be running.
The weekly summary
Once a week the alerter says what the week added up to, and only when it is news. It replaces the daily digest, which in October 2026 on the reference Pi arrived 16 times in 16 days: 10 said "all clear" with only the Wi-Fi's signal changed, 5 repeated what alerts had already pushed, and 1 carried a new fact (a one-minute cut of the Pi itself). That the monitor is alive is the dead man's switch's job, every five minutes; a message every morning to prove it trained its reader to skip it.
Off by default. It needs NOTIFY_MODE set to deliver anywhere. The short
way (Pro):
sudo smoking-pi alerts --weekly mon 08:00 --digest-tz America/Chicago
sudo smoking-pi alerts --no-weekly
sudo smoking-pi alerts status
--weekly takes a day (mon to sun, or the full name) and a 24-hour
time; it checks both, and the zone, before writing anything, recreates the
alerter, and says so when NOTIFY_MODE is off and the summary would only
be logged. It also works together with a delivery mode, for example
--openclaw --to telegram:<id> --weekly mon 08:00. alerts status shows
where alerts go, when the weekly goes, quiet hours and the dead man's
switch.
| Variable | Default | Meaning |
|---|---|---|
WEEKLY_ENABLED |
false |
Opt in |
WEEKLY_DAY |
mon |
mon … sun |
WEEKLY_AT |
08:00 |
Wall-clock HH:MM in DIGEST_TZ; anything else disables it with a warning |
DIGEST_TZ |
(unset) | The zone of the schedule, of quiet hours and of every time a message prints; falls back to TZ, then UTC |
WEEKLY_SILENT |
true |
Deliver without a notification sound |
DIGEST_ENABLED, DIGEST_AT |
(unset) | The retired daily digest's, read only to map an upgraded install: DIGEST_ENABLED=true with no WEEKLY_ENABLED turns the weekly on, at DIGEST_AT when WEEKLY_AT is unset (Upgrades) |
The week
The week is the seven calendar days before 00:00 of the slot's day, in
DIGEST_TZ: on Monday 08:00, Monday 00:00 to Monday 00:00. It is compared
with the seven days before it. A week across a DST change is 167 or 169
hours, as the calendar says.
What it says
In this order, in plain words (the Pi's Wi-Fi, your line, your provider,
individual destinations), never a rule name, never an internal target
name in the headline, every time in DIGEST_TZ, text only:
- One line: a good, mixed or bad week against the one before, by cause, then the week's material episodes, the longest three: when, how long, how many destinations, how much loss. Smaller episodes are counted, not listed: they stay in the incident history.
- Recurring windows: the alerter's recurring
patterns, each with its days this week of the
days observed and, for an older one, since when ("17 evenings of 21
since 28 Sep"), and a pattern gone that week once. For a week the
alerter's record does not cover whole: hours of the day in which loss
or slowdowns the destinations shared came back on at least 3 days of
the week (
RECURRING_MIN_DAYS), from the inference's shared periods (shared_degradation,shared_congestion; none when theinferenceprofile is off) and the incident history's broad episodes, and whether the week before had them too. A window of the week before that did not come back is said once. - The monitor: the share of the week it could measure (a 5-minute bin with no point at all, or a span in which its own Wi-Fi or DNS heard nothing, is not measured), what the watchdog did (driver reloads, reboots, SmokePing restarts) and how many upgrades ran.
- Destinations: at most three with loss of their own, outside the
monitor's deaf spans, the upgrades and the watchdog's actions
(
avg_loss_pct_measurable), only at or above 5 %, by their service label (smoking-pi taxonomy) when they have one. - One link: the Connection quality dashboard over exactly that week, when links are configured.
A week with one cut of the line, the Wi-Fi driver reloaded once, and
Netflix lossy on its own (ALERT_MARKUP=plain; in Telegram the section
titles are bold and the last line is a link reading the week in
Grafana):
🔴 Bad week, 26 Oct – 1 Nov: your line worse (31 min; the week before: none).

What happened
🟡 Wed 28 Oct 20:40, 31 min: your line — 18 of 30 destinations, 25 % loss.

The monitor
🟢 It measured 100.0 % of the week.
🟡 The watchdog reloaded the Wi-Fi driver once.

Destinations
🟡 Netflix: 7.2 % loss of its own.
http://192.168.1.10:3000/d/connectivity-quality-v1?from=1792990800000&to=1793599200000
When it is not sent
A week with nothing material sends nothing: no material episode, no
recurring window this week or the week before, and the monitor measured at
least 99 % of it. The alerter logs one line and records the skipped slot in
its state (weekly.last_skipped):
INFO alerter.weekly: Weekly for 26 Oct – 1 Nov not sent: no material episode, no recurring window, the monitor measured 100.0 % of the week
Material is the alerter's own gate, common/definitions.material()
(see What is material), for every reader:
| What | Bar |
|---|---|
| Breadth | ≥ 30 % of the reporting destinations, or ≥ 2 categories each with half its destinations; never with fewer than 3 reporting |
| Duration | ≥ 15 min (three 5-minute cycles), counted outside the monitor's deaf spans, the upgrades and the watchdog's actions |
| Size | mean loss ≥ 5 % over the episode's destinations, or, for a slowdown, median latency ≥ 2× the same hours a week before |
| The monitor | measured < 99 % of the week |
An episode of the Pi's own Wi-Fi or DNS (local_wifi, monitor) is never
the network's: it counts against the monitor's availability instead.
It never claims a quiet week it did not verify. When the incident
history, the availability, the destinations' categories or the inference's
periods cannot be read, nothing is sent and nothing is recorded as skipped:
it tries again 30 minutes later, three times, and only then retires the
slot with last_error. With the inference profile off its periods are
simply empty, which is not a failure. "Nothing to
report" when the truth is "InfluxDB did not answer" would turn a broken
monitor into a reassuring silence; the dead man's switch reports a monitor
that stopped.
Fires once, however the clock behaves
The loop wakes every ALERT_INTERVAL seconds and has no idea what time it
is between ticks, which is where double-sends live. Each tick resolves the
most recent scheduled instant at or before now — the slot, one a week
on WEEKLY_DAY — and state records which slot last fired. Firing is
idempotent on that: ten ticks in the same minute resolve the same slot and
do nothing.
The slot is persisted, not the send time. Anything recorded before the slot instant — which is what a send-time-like value becomes after an NTP correction backwards, or on a Pi with no RTC — would re-fire it.
A late slot still goes out the same day: a Pi that was off on Monday morning sends the summary when it is back. A slot more than a day old is recorded as fired without sending. Both DST transitions are covered by tests. At most 3 tries per slot (reading the week, then delivering it), 30 minutes apart, then it waits for the next week.
The episodes are the alerter's own (One episode, one
message): the ones it pushed or recorded in the
week, already judged, the monitor's blind spans already subtracted; a
monitor episode counts against the monitor's availability. For a week the
alerter's record does not cover whole (the first week after an upgrade, a
lost state file), the incident history stands in,
judged by the same gate: with INCIDENT_HISTORY_HOURS=0 too, the weekly
sees no episode at all, only the monitor's availability and the
inference's windows. Recurring windows count only episodes the destinations
shared (the breadth bar); one flaky site at the same hour every evening is
that site's, in Destinations.
Message rendering
Messages are Telegram HTML when they go to Telegram (directly, or through
OpenClaw's telegram channel); a webhook and any other OpenClaw channel get
plain text, whatever ALERT_MARKUP says. Two budgets apply: 4096 characters for a plain
message, 1024 for a caption on a message carrying an image — so a chart
costs three quarters of the room.
Rather than truncate, sections are dropped by priority until the message fits,
so what survives is always the head and the cause. An episode's message
(templates.episode_sections, rendered by templates.render) is its head
in bold, the cause line and the first signal (never dropped), then the
range link, then the contrary signal, then the other signals -- the extra signals go first, then the contrary, the link last
among what can go, because the link is the way out of a static caption. Only if the headline
alone still overflows is text trimmed, and then on a line boundary: an HTML tag
cut in half makes Telegram reject the whole message with a 400, which
/tools/invoke reports as HTTP 200 with {"ok": false}.
Every interpolated value is escaped. Target names are user-editable, and
a<b&c is a legal one.
The chart
The opening message of a material episode (the Internet down, or a
material degradation) carries one chart -- never an update, an end or the
monitor's message: the destination that lost most, with the others of its
category as context, from before the episode to now. It is the chart
get_chart draws, sent as an inline photo; not while the outbox holds
anything, and any failure sends the text alone. ALERT_CHARTS and
CHART_HOURS stay retired: there is no switch.
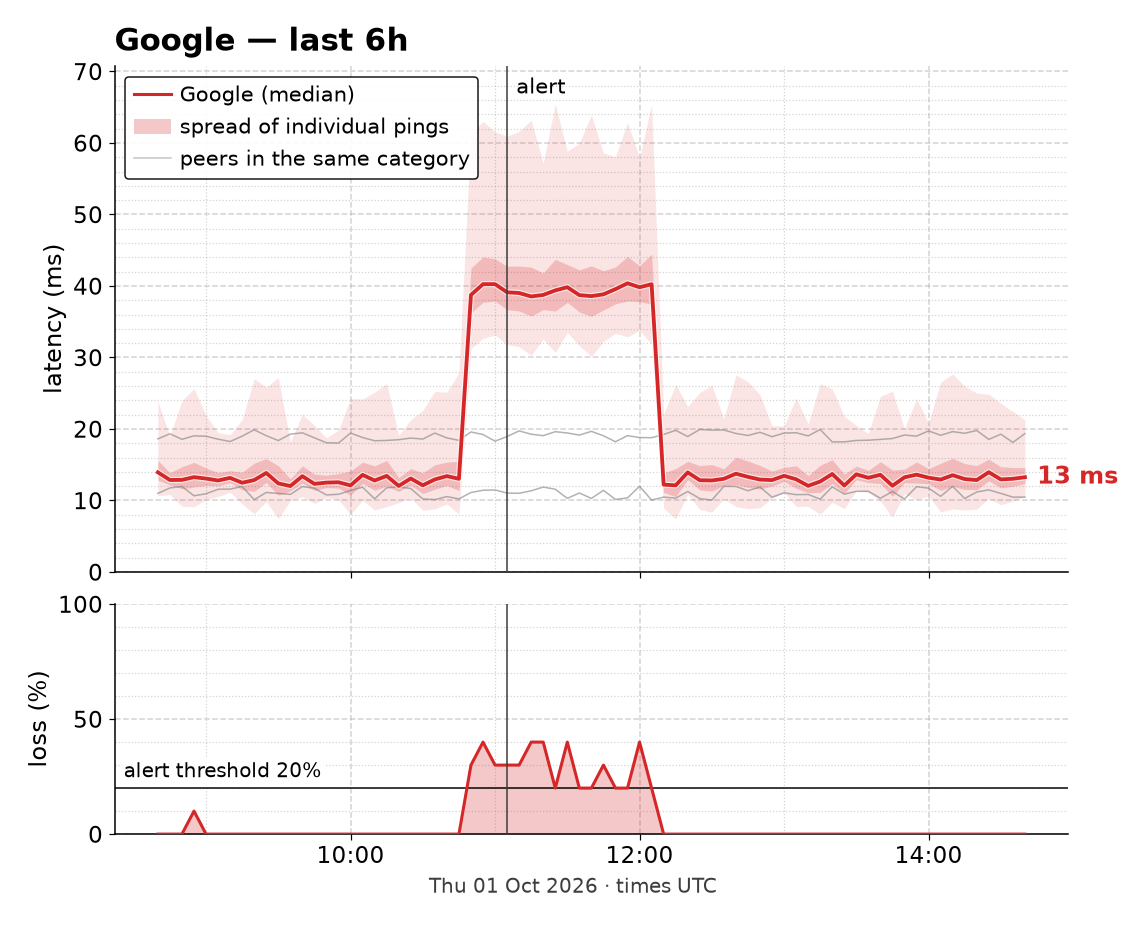
- Latency on top: the median as the line, the spread of the individual pings as two shaded bands (min–max, and the inner quartiles), the same-category peers as thin gray lines, and the last value labeled.
- Loss underneath, on an axis pinned to 0–100, with the alert threshold
(
HIGH_LOSS_PCT, 20) as a solid line; on the CPE gateway's chart it is the microcut threshold (MICROCUT_LOSS_PCT, 50) instead. Two panels, never two y-axes on one. - The alert as a vertical line at the moment the incident opened. The
series wears the severity's color (red for critical, orange for
warning); a chart someone asks for (
get_chart) wears plain blue. - When a few windows peak far above the rest, the scale is set by the bulk and a note in the corner says how many were clipped and the maximum, rather than flattening everything else.
CHART_THEME=dark draws the same chart on a dark page:
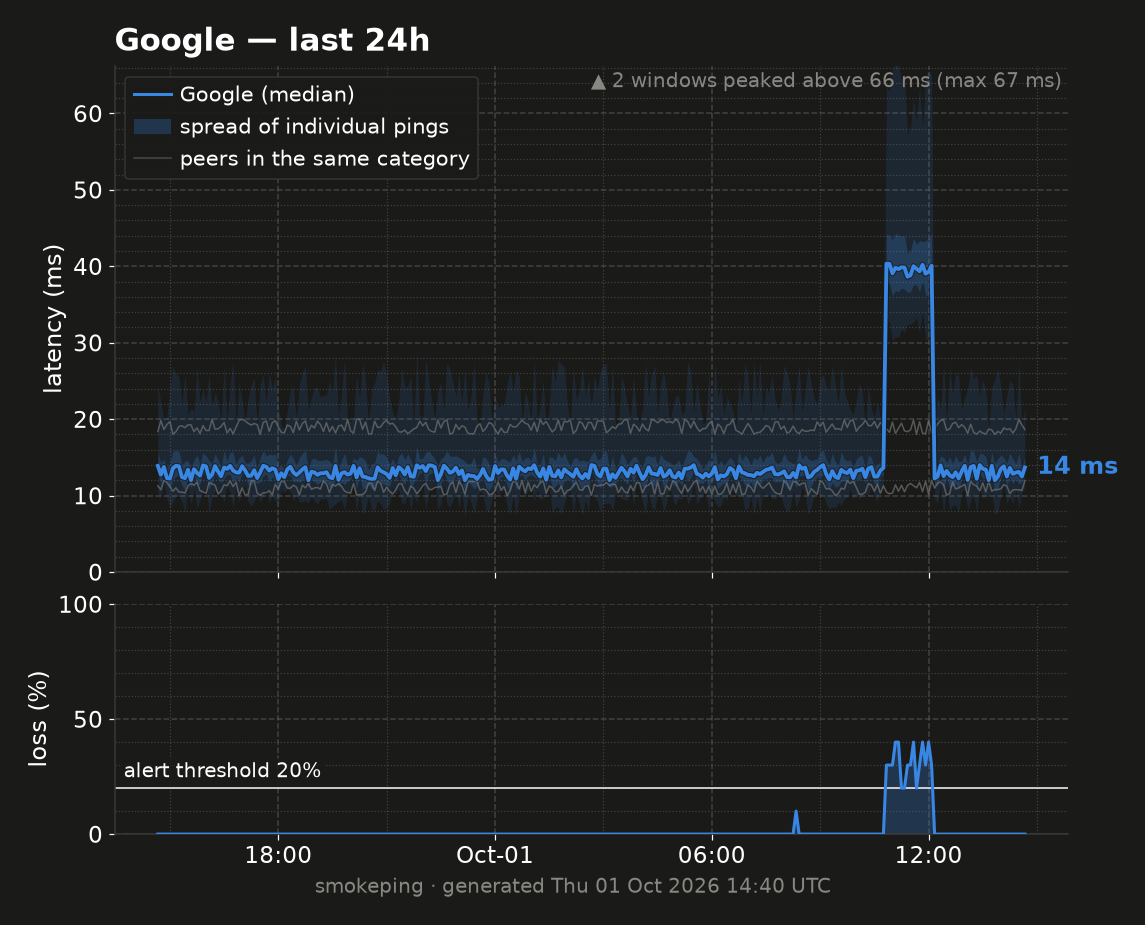
These images come from tools/chart-examples/render.py, which runs the real
renderer on invented data; rerun it when the chart code changes.
The links row
An episode's message has one link, its range (common.links.range_link:
the Overview, or the Wi-Fi link dashboard for this Pi's radio, from and to
the episode's own minutes). The row below is the weekly summary's and the
older per-target shape's:
graph · per-ping · peers · edit, followed by 🌐 anywhere when a tunnel is
configured (TUNNEL_BASE_HOST — see
Two tiers). An alert is
read on a phone that may or may not be on the home network, and a LAN URL is a
dead link from a train.
Only the graph gets a from-anywhere twin, not all four. A Grafana deep link runs to about 120 characters; mirroring the whole row would spend a quarter of a caption budget saying the same thing twice. Whoever is on cellular wants the picture, and the rest of the dashboard is one tap from it.
Every link points at Grafana, and the reader logs in. There is deliberately
no public link. Grafana snapshots would have offered one — a URL anybody can
open with no account — and they are switched off (GF_SNAPSHOTS_ENABLED=false,
plus GF_SNAPSHOTS_EXTERNAL_ENABLED=false, which otherwise defaults ON and
publishes to the third-party snapshots.raintank.io). Verified: creating one
now returns 403 Dashboard Snapshots are disabled even as admin.
That is a deliberate trade. A snapshot is a permanent, unauthenticated URL with the measurements embedded in it, and everything else on this host sits behind a login, so leaving it enabled would be the single hole in that — one reachable by a click in a share dialog, by someone with no reason to expect the result to be world-readable. The alert already carries the chart as an image and the dashboard as an authenticated link, which is the whole promise: the answer and the picture arrive in the message.
Set ALERT_MARKUP=plain for a channel that does not parse HTML.
Testing
One-shot evaluation (no loop) with whatever NOTIFY_MODE is configured:
cd editions/pro      # from a clone
COMPOSE_PROFILES=alerts docker compose run --rm alerter python main.py --once
With NOTIFY_MODE=off this logs the active signals and the episode without
sending anything -- a safe dry run. tests/test_october.py replays the
audited month through the whole cycle. Unit tests live in
shared/modules/alerter/tests/ and run in CI (module auto-discovery):
cd shared/modules/alerter
pip install -r tests/requirements.txt
pytest -q
Muting alerts without losing them
A mute keeps a signal out of every episode (mute amazon for 2h: its
loss neither opens nor extends one), or, by its key episode:<id>, keeps
one episode unsaid -- no alert, update or end message -- while it is
still recorded. The rules still evaluate, and list_alert_state still shows
the muted signal.
Control is natural language onto MCP tools rather than buttons on a message:
mute_alerts, unmute_alerts, ack_incident, list_alert_state. Telegram
buttons cannot call back without an OpenClaw channel plugin, and the tools are
the better interface anyway — "mute amazon for two hours, I'm reflashing the
router" carries a scope, a duration and a reason that no button could.
Single-writer, so there is no lock
Two containers share this state. Neither locks, and neither needs to:
| file | writer | readers |
|---|---|---|
/var/lib/alerter/state.json |
alerter | alerter (rw), mcp-server (ro) |
/var/lib/alerter-mutes/mutes.json |
mcp-server | mcp-server (rw), alerter (ro) |
Neither container ever read-modify-writes a file the other writes, so the race
is eliminated by construction — there is no lock to acquire and none to leak.
The :ro bind mounts in docker-compose.yml make that an OS-enforced
invariant rather than a convention a later change can quietly break.
Cross-container reads are safe because both writers use a temp file in the
same directory plus os.replace. That was introduced as crash-safety; it is
now also the concurrency contract, because os.replace is atomic within a
filesystem — a reader sees the whole old file or the whole new one, never a
torn one. Do not "optimize" either writer into an in-place write.
Expiry is evaluated at read time and pruned lazily on the next write, so readers never need to write a file their mount forbids them from writing.
Muting is the one feature that can cause a missed outage
So every mitigation lives here rather than being left to operator discipline:
- 24-hour cap (
mutes.MAX_HOURS). A longer request is clamped, not rejected, and the response says what it actually granted. list_alert_statelists active mutes; with the weekly, the 24-hour cap is what keeps a forgotten mute from lasting.- An episode muted from its first message produces no end either.
Announcing the end of something nobody heard about is just noise. One
acknowledged after it was told (
ack_incident("episode:<id>")) says nothing more, its end included; a mute by target or rule keeps that signal out, and the episode's end is still told. - An ack ends when its incident recovers.
ack_incidentwrites the time it was made (created_at); the alerter, which may not write the mutes file, applies it only to an occurrence first seen before then. The same key opening again after a recovery is a new problem and alerts. unmute_alerts(all=True)clears everything in one call.- A missing or corrupt mutes file means everything alerts. Delivery must never depend on this file being readable; the failure mode has to be noise, not silence.
There is deliberately no catch-up on unmute: what a mute kept out of an episode is not replayed into it. A burst of stale notifications on unmute would be its own kind of failure.
Where the check sits, and why
In episodes.signals, before a signal can open or extend an episode, with
the key's first_seen from the signal records (so an ack covers the
occurrence it acknowledged); and in policy.decide for an episode key.
Neither writes the mutes file: the alerter's mount is read-only.
Probe cadence
Every rule above counts probe cycles, and SmokePing's cycle is set per probe:
its step (300 s as shipped) and its pings (10 for FPing, 5 for DNS,
HTTP and TCP). The exporter writes both as fields on every latency and
dns_latency point, and the alerter reads the latest per target before
each evaluation (common/cadence.py). A target with neither, such as a
point from an older exporter, counts as 300 s and 10 pings.
What follows from a target's cadence:
DOWN_WINDOWandSTALE_WINDOWare never shorter than four steps of the slowest probe, andALERT_RESOLVE_AFTERis never shorter than three. On a 600 s probe the configured 1200 s would hold two points wheretarget_downneeds three, and it could never fire.- The mean behind
high_lossandipv6_downcovers three steps of the slowest probe: 15 min on the shipped step. Persistence counts each target's own latest three cycles. outageand the total-loss rules bucket points to the slowest step. A faster target's several points in one bucket are averaged, so one lost point of five does not make it "lost" for that cycle.
Loss is counted in pings lost, not in a fixed percent. A point is a
loss event when it lost more than 1.5 pings' worth, of however many its
probe sends: 15% on FPing's 10, 7.5% on a 20-ping probe, and 30% on DNS,
HTTP and TCP's 5. A fixed 15% meant "2 of 10" on FPing but "3 of 20", and
one lost DNS query of five cleared it. It is 1.5 and not 2 because the RRD
spreads each cycle's lost pings over two aligned steps, so loss values are
not whole pings: on the reference Pi, seven days held values at every
percent from 1 to 13. Persistence for high_loss, the outage floor and
the loss events that get_loss_events, the weekly summary and the AI report count
all use this rule (common.cadence.EVENT_LOST_PINGS). The high_loss mean
threshold (HIGH_LOSS_PCT) stays a percent: it is an average, not a count.
The Grafana panels draw two overlays on each per-target latency panel, and neither says "downtime" unless nothing answered:
- The red Unreachable (nothing answered) bar marks a 15-minute window
in which every cycle lost every ping (
lossat 1.0 on each point of the window). A window that answered anything, however little, is not unreachable: a 5% window has 28 answered pings of 30. The first and last windows of an outage usually answered something, so they are lossy, not unreachable; the bar starts at the first window that lost it all. - The lighter orange Lossy (≥ 1.5 pings lost in 15 min) bar follows
the loss-event rule above: a window is marked when it lost 1.5 pings'
worth in total (the sum of loss × pings over the window). On the shipped
300 s step that is the old "15-minute mean at 5% or more" (5% of 3 × 10
pings), and it stays one lost ping short of a mark whatever the step.
Points written before the exporter recorded
pingscount as 10 forlatencyand 5 for DNS, HTTP and TCP: what those probes always sent.
Each bar is exactly one window wide and sits over the window it judges. Both series are dense (a 0 for every unmarked window, which draws nothing), because Grafana sizes bars by the spacing of the points it is given: until 2026-10-15 the series held only the marked windows, so one marked window at 12:45 and the next at 14:45 were drawn as a single bar from one to the other, and a lone mark was as wide as Grafana's guess. That is the "Downtime" block over hours of good measurements that prompted the change. A window with no measurements at all (SmokePing stopped, the exporter behind) is left blank in both overlays: no data is not nothing answered. The overlays stay out of the tooltip, and they draw on a hidden scale of their own, from 0 to 1, so a marked window fills the panel's height without touching the latency axis. Until 2026-10-16 a marked window was a bar 500 ms tall on that axis: one lossy window stretched a panel of 10 ms resolver lines to 500 ms and flattened them.
The ClickHouse dashboards apply the same two rules from packet_loss
(every point at 100 for unreachable) and packet_loss × packets_sent
(lossy), with the same 10 and 5 for a step that lost everything, because
the ClickHouse exporter writes no packets_sent for such a step. The
alerter's flat default of 10 is a different case. It reads each target's
latest pings from the last 6 hours, and the alerter ships in the same
release as the exporter that writes it, so every target has a real count
within one exporter cycle (60 s).
On the shipped probes, the loss-event rule is exactly what it was. The only difference is that one lost DNS query (20%) is no longer an event. On the reference Pi, seven days of loss events came to 843 under both rules. The lossy overlay's only difference is the same one: a single lost fetch or query out of 5 does not mark a window.
Flap damping
The per-rule lifecycle this section used to describe -- ALERT_COOLDOWN
re-notifications, a recovery per incident key, a ceiling per key -- is gone
with front 8: an episode is said once and its end once, so a flapping rule
can at most keep one episode open longer. What stays from that history:
DOWN_WINDOWis 1200 s -- four points where three are required, so one point of slack absorbs the jitter. Atarget_downon an unroutable test target once flapped on a five-minute cycle withDOWN_WINDOW=900(exactly three points) and sent 48 notifications every two hours. A compose default silently overrides a module default, sodoctor'scheck_alerter_env_defaults_matchfails CI when they disagree. If you retune either value, keepDOWN_WINDOW / 300strictly greater thanDOWN_MIN_POINTS.- An episode closes only after
ALERT_RESOLVE_AFTER(900 s) without evidence, and never while the monitor is blind or no destination reports: a signal that drops out on ordinary jitter and returns is the same episode. ALERT_MAX_PER_HOUR(6) caps alerts and updates per rolling hour across every episode, independent of the policy above: unreachable when it works, and a bound on the cost if it is ever wrong.0disables it.