The path to each destination (experimental)
Experimental
The path meter is off by default, is not in the alert path, and may change or go away without a deprecation period. Its results show on the Target Detail dashboard; nothing pages anyone.
The measurements say how long a destination takes to answer and whether it
answers. They do not say which way the packets went. The pathmeter
service traces the path to every measured destination once an hour, so a
latency step can be read next to the path it happened on, and a change of
route shows up as a change, not as a guess.
smoking-pi enable pathmeter
Pro with InfluxDB only. IPv4 only, like the rest of the Pi's measurements when it has no global IPv6 (IPv6 gating).
What it does
Every PATHMETER_INTERVAL seconds (default 3600):
- What to trace. Every target measured in the last two hours, by its
base name (
Google,Google_tcp443andGoogle_h2are one destination, as on Target Detail), from the host behind it. Names are resolved every cycle, since CDN names move, and names that resolve to the same address are traced once. - How. A Paris traceroute with scamper,
over ICMP: every probe to one destination keeps the same flow
identifier, so a load balancer on the way keeps them on one path and the
hops read as one path, not a mix of several. The identifier is the same
every cycle too, so a destination stays on its path from one hour to the
next unless the network moves it. One probe per hop, a second
to wait for each, and the trace gives up after five silent hops in a row.
Every probe of a cycle is paced together at
PATHMETER_PPSper second (default 5), so no router on the way, shared or not, ever gets more than that from the Pi: about two minutes a cycle for 76 destinations. - Never a burst at the router. The first hops are the same for
every destination: the home router, then the access network. A hundred
traceroutes that each start at hop 1 would send a hundred probes at the
router at once, and the same at every shared hop after it. So each cycle
traces only four destinations from hop 1, in turn (the ones whose
last full trace is the oldest), and every other destination from the
first hop past the shared ones. The shared hops are learned from the
latest full trace of every destination, so they move as soon as one of
them shows the access path moved: a new gateway or a failover is
followed in the cycle that sees it, and the destinations traced before
it go first next. The router and each shared hop receive at most four
probes a cycle (eight in the first cycles after the service starts or
the access path moves),
whatever the number of destinations; every destination is traced from
hop 1 once every destinations ÷ 4 cycles (19 hours for 76). Routers
past the shared hops that many paths cross (a provider's edge) get one
probe per destination crossing them, never faster than
PATHMETER_PPS. Until the shared hops are known, the destinations not yet traced from hop 1 wait for their turn rather than all crossing them at once.
One limit follows: a destination's own change inside the shared hops (it alone left them) is confirmed only by its next trace from hop 1. 4. What changed. A path counts as changed when a hop that answered both times answered from another address (or the destination got nearer or further), in two traces in a row: one trace that differs is a candidate the next confirms or drops, so a load balancer or a router answering once from another of its addresses is not a change. The AS path (the networks along the hops, see Where the networks come from) changing is flagged on its own, because it is usually the change that matters, and only once every hop's network is known, so a lookup still pending is not a change of network. A name with several addresses keeps the one it was traced at while DNS still returns it; one that resolved to a new address starts a new path, and that is not a path change.
During a loss episode
The hourly traces describe a quiet hour. When every destination loses packets at once (the reference house had such an episode most evenings from late August to early October 2026), the question is where: inside the access network every path shares, or beyond it. So while a shared loss episode lasts, the path meter traces the destinations it hit every five minutes.
- What an episode is. The alerter's widespread rule, as
get_loss_eventsreports it:WIDESPREAD_PCT(80 %) of the targets reporting in a probe cycle had a loss event of at leastWIDESPREAD_LOSS_PCT(30 %). The path meter has no detector of its own; it asks every five minutes for the last hour's widespread runs, and an episode is under way while its last lossy cycle is at most three steps old (the exporter writes a cycle a step after it ends, and a run carries across two missing ones). A run the rule reads as this host's own uplink down, or its own DNS, is not traced: nothing past a dead uplink answers, and a DNS failure is not on the path. The check itself is the last hour's loss-event queries every five minutes, a fraction of a second each. - What a round traces. The destinations with a loss event in the episode first, then the others, each in turn (the one traced longest ago first), so a long episode covers all of them. One of each round's traces starts at hop 1, in turn: it shows the shared hops answering or not, hop by hop. The others start past them, as the hourly cycle's do. The home router gets at most twelve probes an hour more. No name is resolved during an episode: each destination is traced at the address its last hourly trace used.
- The cap. At most
PATHMETER_EPISODE_TRACES_PER_HOURtraces (default 60, five a round) in any sixty minutes, counted from a ledger in the service's state volume before each round is sent, so a restart or a crash mid-episode does not start a new hour. The affected destinations a round left out are counted ascapped. - One loop. Rounds and the hourly cycle run one after the other, never
together, so
PATHMETER_PPSholds over both; while a cycle runs (about two minutes) the rounds wait.
Round traces are tagged trigger=episode in InfluxDB (see below) with the
episode's start, so a panel can show them apart from the hourly ones or
leave them out. They are never part of the change tracking: a path seen
every five minutes while it loses packets is not two hourly traces in a
row. On Target Detail the Last trace in range of a range that ends
during an episode is its last round's.
Reading them: a round whose hop-1 trace goes silent inside the shared hops, while the hops past them stop answering too, points at the access network; the shared hops answering while the paths beyond them go silent at different places points beyond it. A router's own replies are rate-limited (see above), so one silent hop is not evidence: compare rounds.
Why ICMP, and why Paris
Measured from the reference house on 2026-10-21, over its 76 destinations:
| Method | Reached the destination | Probes per trace (median) |
|---|---|---|
| ICMP Paris | 60 of 76 | 13 |
| UDP Paris | 34 of 76 | 14 |
| TCP to port 443 | 7 of 76 | 15 |
Plain traceroute and mtr change the flow identifier on every probe, so
behind a load balancer they draw a path that does not exist. Tracing every
equal-cost path (scamper's MDA) costs many times more probes and is not
done.
Where it shows
On Target Detail, the collapsed Path (experimental) row:
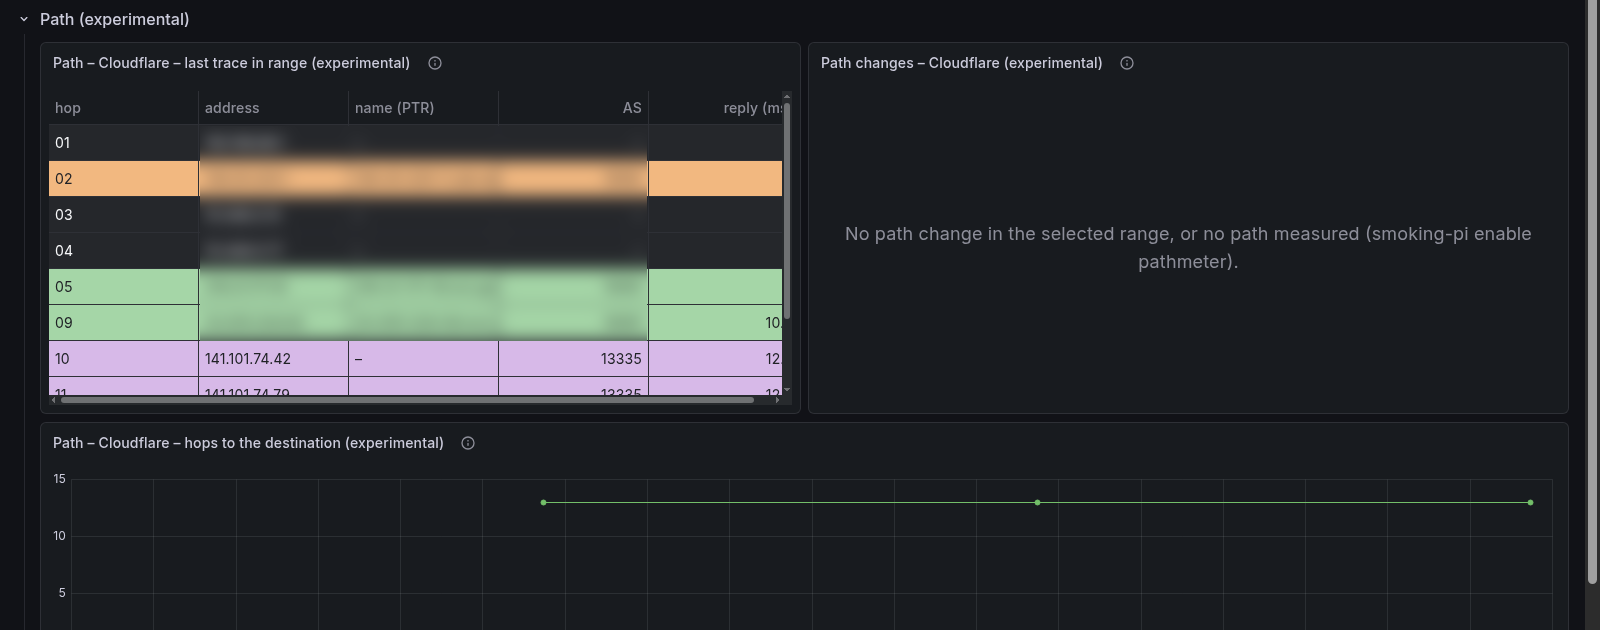
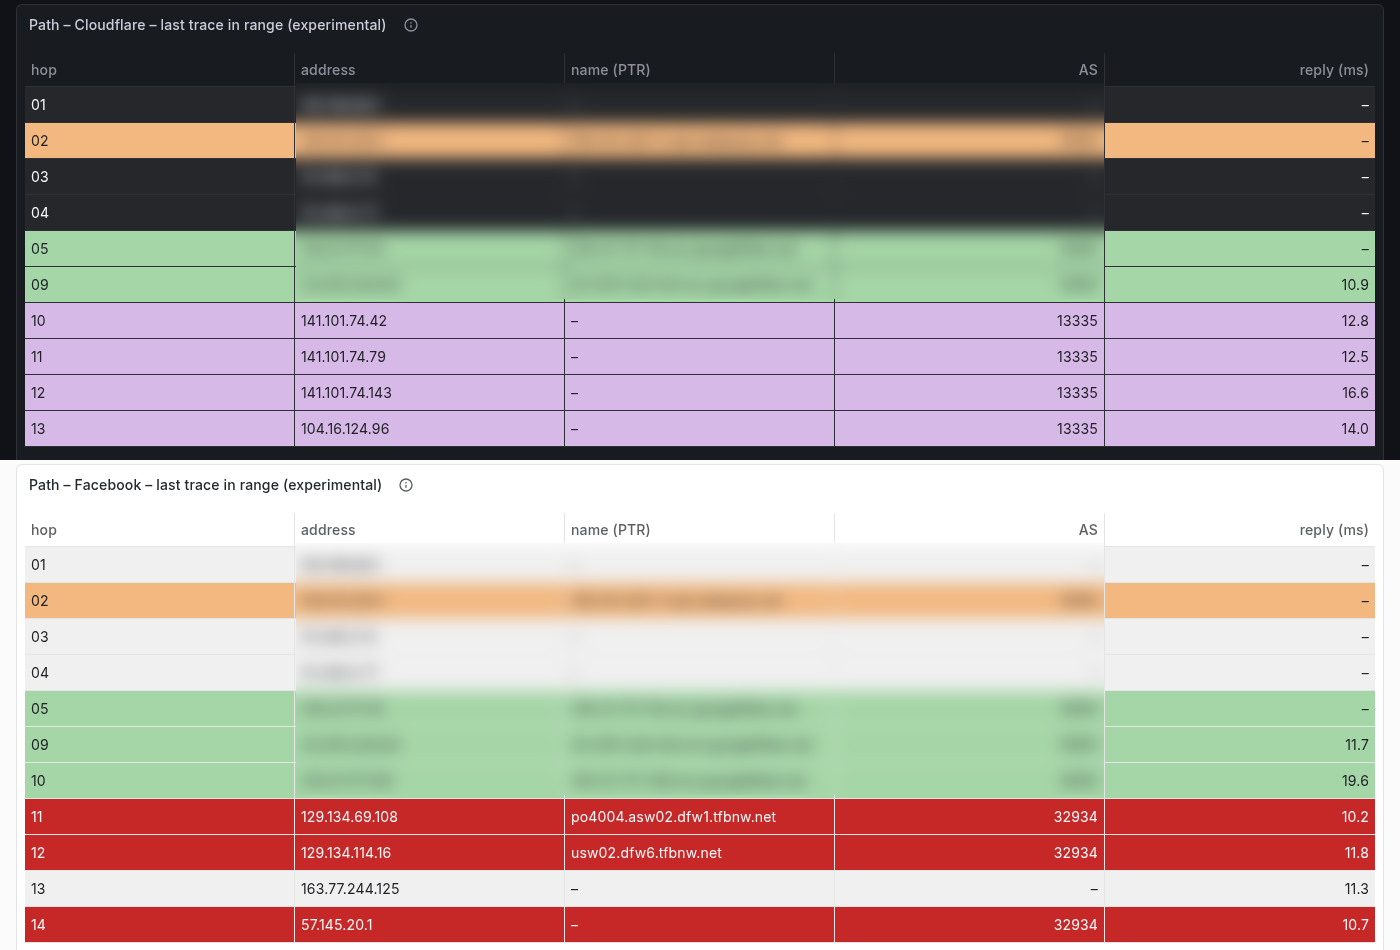
- Last trace in range: hop, address, AS and reply time of the last trace in the selected time range. Pick an earlier range to see the path as it was then. Hops that did not answer are left out. The shared first hops of a destination traced past them show their addresses but no reply time: only one destination probed them that cycle.
Each row takes its network's color, so a run of hops in one AS reads as one block and the hand-off from one network to the next stands out. The color comes from the AS number (the AS number modulo the twelve colors), so a network has the same color on every target and every refresh; two networks can still share one, so read the AS column when two blocks of one color touch. Hops with no AS, and private (RFC 1918), CGNAT (100.64.0.0/10), IPv4 loopback, link-local and ULA addresses, are gray; so is a router on an exchange point's LAN when no AS is known for it (its exchange column still names it).
 - Path changes: when the AS path, the hops or the address changed in
the range.
- Hops to the destination: how far the destination answered, per trace.
The Path changed (experimental) annotation marks confirmed changes on every panel of the dashboard.
With the inference module on too, every loss period the whole connection shared gets a hypothesis of where on the path a common cause would sit: the router, network or exchange the destinations that lost cross and the others do not. Connectivity & Quality lists it under who lost.
Every destination side by side (which networks they are in and share, which networks answer at each hop, and how one destination's path moved next to its RTT and loss) is the Internet Topology dashboard.
A router's reply time is how fast its own slow path answers a probe that expired there, and routers rate-limit those replies. It describes the hop; it is not that hop's latency, and a slow or silent hop says nothing about the traffic going through it. The reference house's own router answered the first hop on only two traces in three.
Where the networks come from
Each hop's network (its origin AS) is looked up locally with originet (formerly map-ip-to-asn), a Rust longest-prefix-match table over CAIDA's daily RouteViews prefix-to-AS snapshot: about 4 MB compressed and 1.1 million IPv4 prefixes, checked for a newer one once a day, cached in the service's state volume (the two newest kept) and loaded in a few seconds. Every hop is answered at once by its longest announced prefix: no query per address, nothing rate-limited, and the first cycle already complete. A prefix announced by several networks reports the first of them, as originet does.
A router can answer from an address on an exchange point's LAN (an
IXP): its port on the exchange. Then the hop is named by the exchange (the
exchange (IXP) column, with its city when known) and its network is the
member that uses that port, not whoever announces the LAN: on the
reference house, 206.223.118.40 is Transtelco's port (AS32098) on Equinix
Dallas, in a /23 AS18734 announces, and the hop after it is Transtelco's.
Both come from CAIDA's monthly
IXP dataset (PeeringDB,
Packet Clearing House and Hurricane Electric merged: about 1,600 exchanges
and 80,000 IPv4 member addresses), checked weekly. An address the dataset
lists under two networks (sibling networks, route servers) is given
neither: its hop keeps the network that announces the exchange's prefix. A private hop (the home
router, the access network's 10.x routers) has no network, by design.
Each network's name (HURRICANE - Hurricane Electric LLC, US) comes from
CAIDA's monthly AS Organizations
dataset, also checked weekly.
A download that fails keeps what is loaded, and a restart without network loads the cached snapshot; a snapshot that looks broken (fewer than half a million prefixes) is refused; a failed download is tried again an hour later. The first start downloads about 17 MB (the routing snapshot, about 4 MB, then daily when CAIDA publishes one; the IXP dataset, about 8 MB, and the AS names, about 5 MB, monthly) and takes about half a minute on a Pi's half core; a restart afterwards, a couple of seconds.
Because the table answers by the exact announced prefix, takes the first origin of a prefix several networks announce and the member for an exchange port, a hop's network is the one the service labels show for the same address: the exporter reads the same table.
All of it is downloaded by the Pi itself, for its own measurements, and never shipped in an image or this repository; the data is CAIDA's (RouteViews prefix-to-AS, IXPs, AS Organizations): cite it if you publish results from it.
Router names
Next to each hop the path table shows its name (PTR): the reverse DNS
name the operator gave the address. It is often the best hint of where a
router is and what it does: be1.core1.hou2.he.net is a Hurricane Electric
core router in Houston, 192-200-234-53.mci.googlefiber.net a Google Fiber
router in Kansas City, ipv4-c366-atl001-ix.1.oca.nflxvideo.net a Netflix
cache in Atlanta. It is also only a name: operators let them go stale, and
some do not set one. So a name is shown with its hop and never used to
judge a path: it is not part of the path, its hash or its changes, and a
router renamed is not a path change.
Public addresses only. Each address is asked once a week through the Pi's resolver (one with no name again after a day, a failed query after an hour), at most 100 new queries a cycle, eight at a time: the first day of the reference house asked about 250, the days after almost none. On the staging Pi, 43 of 66 routers had a name.
What it costs
The routing data is about 4 MB a day of download when CAIDA publishes a
new snapshot, plus about 13 MB a month for the IXP dataset and the AS
names, not counted by smoking-pi budget (the netmeter counts it under
pathmeter).
At the defaults, about 600 probes an hour for the reference house's 76
destinations (about 3 % of the default samples ceiling) and a few MB a day.
Of those, the home router receives four an hour. For comparison, the CPE
microcut detector already sends the ISP's first hop 50 pings every 30
seconds.
smoking-pi budget shows the path meter as a Traceroute row with what
its cycles of the last day actually sent, on average, not an estimate,
and counts it in the totals
that admission checks a change against.
The episode rounds are reserved at their worst case, as an EpisodeTraces
row: the hourly cap times the probes a round trace costs (measured over
the last day's rounds, 13 until there are some). At the default, about 780
probes an hour (4 % of the default samples ceiling) and 2 MB a day, counted
whether an episode is under way or not, so admission keeps room for one. An
episode of three hours sends about a quarter of a megabyte.
Enabling it is not refused by admission: check smoking-pi budget first
on a connection that is close to a ceiling.
Settings
| Setting | Default | |
|---|---|---|
PATHMETER_INTERVAL |
3600 | Seconds between cycles; at least 600 |
PATHMETER_PPS |
5 | Probes per second, every probe of a cycle together; at most 100 |
PATHMETER_EPISODE_TRACES_PER_HOUR |
60 | Traces in any hour during a loss episode; 0 turns them off; at most 1200 |
smoking-pi config set PATHMETER_INTERVAL 7200 changes one.
In InfluxDB
Tagged target (the base name) and category, stamped at the cycle's
start:
path_trace, one point per destination and cycle:dst,hops,reached,path(addr|addr|*|…,*a silent hop),path_hash,as_path(64500 64501 15169),changed,as_changed,dst_changed,first_hop.path_hop, one point per hop that answered, also taggedttl(01,02…):addr,ptr(its reverse DNS name) when it has one,asnwhen known,as_name(that network's CAIDA AS2Org name,HANDLE - Organization, CC) when the routing table has one,ixp(the exchange point's name) when the address is on an exchange LAN,rtt_ms.pathmeter_pass, one point per cycle:traces,probes,seconds,failed,prefix_hops,full_traces.
The rounds traced during a loss episode write the
same three measurements, every point tagged trigger=episode (the hourly
ones have no trigger tag), plus episode (the episode's start, an ISO
time) on path_trace and capped on pathmeter_pass. To leave them out
of a query: filter(fn: (r) => not exists r.trigger).
Addresses are fields, not tags, so routers do not multiply series.
Privileges
The container runs on the host network (the hops are the house's, not a
Docker bridge's plus one) with every capability dropped but four:
NET_RAW for the probes, and SYS_CHROOT, SETUID and SETGID for
scamper's own privilege separation, which runs the part that parses what
the network sends back as nobody, chrooted in an empty directory.
Not yet
- A limit per network, so a large set of discovered targets does not concentrate probes on one operator (measurement budget, What comes next).