One target, every layer
The Target Detail dashboard answers "show me everything about this one destination". Pick a target from the dropdown and one page shows what Smoking Pi measures for it, layer by layer:
| Layer | Measurement | What it tells you |
|---|---|---|
| ICMP | latency |
The network path, with no application in the way |
| TCP handshake | tcp_latency |
SYN / SYN-ACK to port 443: the transport floor under HTTP |
| HTTP/1.1, HTTP/2, HTTP/3 | http_latency |
A HEAD request over each version, and how often one failed |
| DNS | dns_latency |
A query answered by this target, when the target is a resolver |
The first row says when the target was last measured, whether it is measured now, how long this Pi's radio was deaf in the range, and what the target is, in two tiles side by side, from the last label the exporter recorded (Service taxonomy). Service shows the service's name large ("Universidad de Buenos Aires") with its categories in small text over it ("academic", "social, video"; "unknown (no rule yet)", in orange, when no rule labels it, and the name is then the target's title). Delivered by shows the operator of the network its host answers from large ("Imperva") with that network's kind over it ("CDN", "content network", "embedded cache"...); "network not identified" for a host with no IPv4 answer yet. Both say "no label yet" until the exporter writes one.
The tiles below give the median and the loss for each layer over the
selected range. A layer the target has no probe for, or whose probe wrote
nothing in that range, says not measured,
so you can see at a glance what exists and what does not. The DNS charts
of a target with no DNS layer say so ("no DNS data for this target in this
range") instead of drawing empty axes; the dashboard opens on Google, and
Google's resolver is its own target (see below). The tiles' medians are the
median of SmokePing's per-cycle medians over the range, so a tile can differ
slightly from the median line below it, which pools the individual pings.
Below the tiles, each layer has its latency over time, where the line is the
median and the shaded band the 10th to 90th percentile of the individual
pings in each point's window, plus its loss. HTTP draws one median line per
version instead of a band.
A point's window is one 5-minute measurement cycle on a short range (a day, or a week on a wide screen) and several cycles on a long one: Grafana draws about one point per pixel, so 30 days put roughly eight cycles behind each point. The percentiles are always those of every ping in the window, pooled, not an average of each cycle's own percentiles: averaging pulls the 10th percentile up and the 90th and 99th down, hiding exactly the slow pings a long range is opened to find. The values are still SmokePing's: each stored ping is the RRD's, which blends a little of the neighboring cycle when a measurement lands off the step.
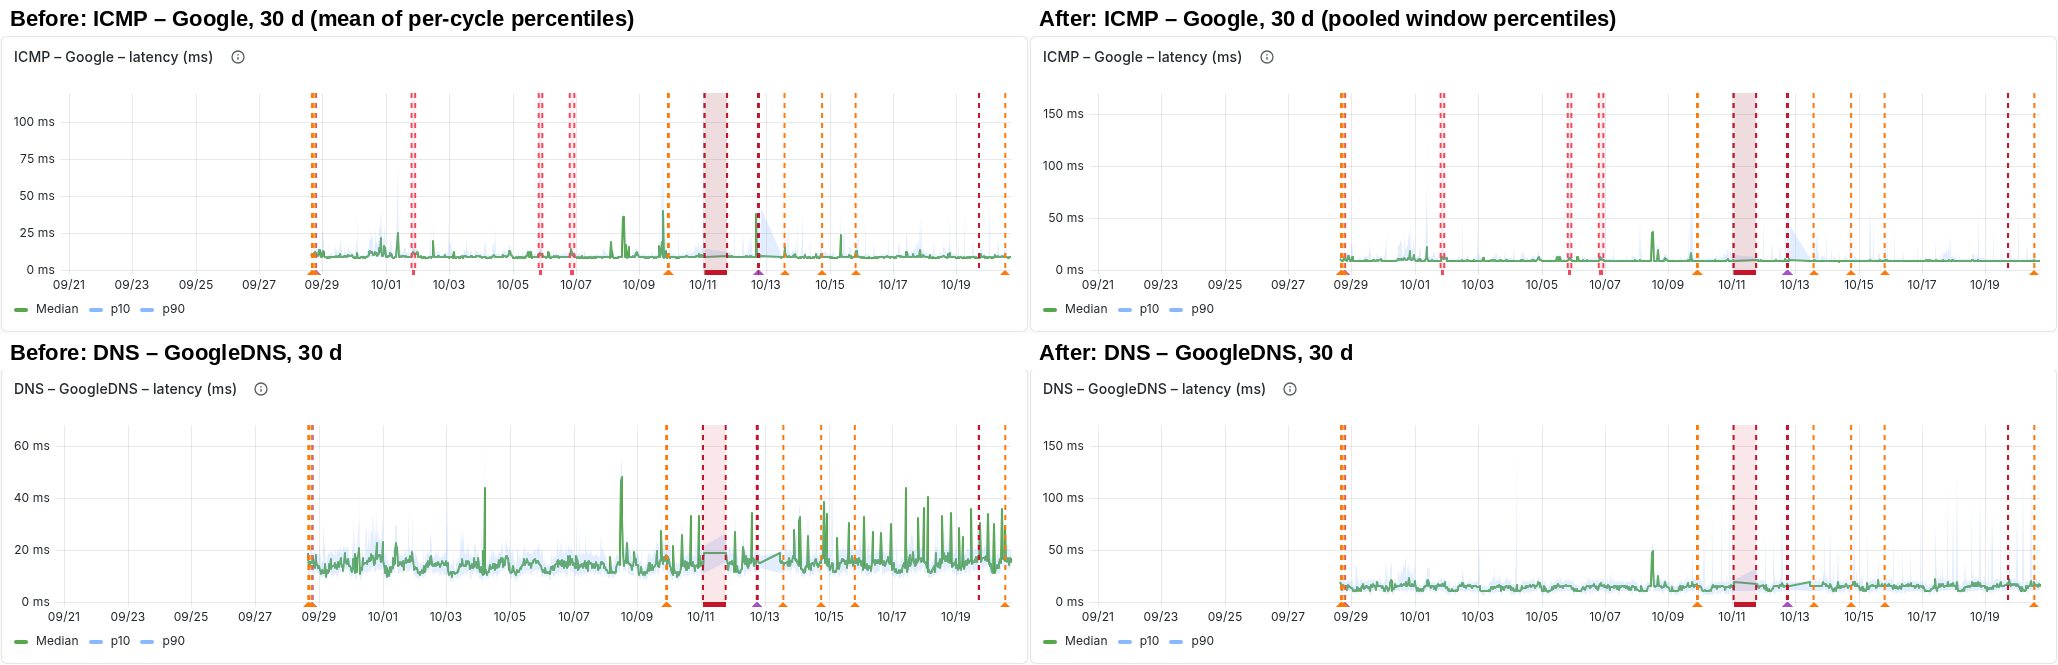
Resolvers are targets of their own. Google has ICMP, TCP and HTTP but no
DNS layer; Google's resolver is GoogleDNS, whose DNS charts are the ones
that fill.
Open it from the dashboard list (SmokePing dashboards), or with the Target detail link at the top of the Overview, the latency, resolver, per-ping and HTTP-by-version dashboards: those carry the target you are looking at.
A target that stopped being measured
The first row says whether the page describes the present. Time since the last measurement is the age of the newest point any probe of the target wrote inside the selected range, relative to now: green within 11 minutes (two steps at the default 5-minute step), orange within a day, red beyond, and "no data in this range" when the range holds nothing from it. A red tile means every number beside it is history, however recent the range looks.
Is it measured now? says "measured in the last 24 h" when the target wrote a point in the last 24 hours, whatever range is selected. Otherwise it says when the target stopped (looking in the range and the 30 days before it), and what it can about why:
- A retired Netflix appliance name (the
Ocean_Reef_…_5style names theNetflix_<slot>_<site>targets replaced) ends in its slot number, so the tile names the live slot that carries that number and since when, from thetarget_hostrecords: "retired name: its slot is measured asNetflix_5_ATLsince 2026-10-12". Click the text to open that slot, or the Netflix side-by-side. The slot is matched by its number and not by the appliance's address on purpose: the slots keep their names while the appliance behind each changes daily, so "the same appliance" is true for a day at most. - Any other name: "nothing measured since", which is a target removed from the configuration or a probe that stopped. The Diagnostics dashboard lists the series that went silent.
The target dropdown offers the names with a point in the last 24 hours, so a retired name is reached only through a link or a bookmark; the dashboard still shows whatever history the name has.
Monitor deaf in range is the time inside the range in which
this Pi's own radio heard nothing: the alerter's incidents diagnosed
local_wifi and the inference module's periods labeled monitor_deaf,
taking, of the periods that start together, the shortest: the span every
target labeled then shares. The loss tiles are the mean
over the range with those minutes included, so a target that was fine while
the monitor was deaf still shows loss; subtract the deaf minutes before
blaming the destination. The Monitor deaf and Loss incidents
annotations mark the same spans on the charts.
How targets pair across probes
Each probe writes its own target name, and the dashboard pairs them by the name without its probe suffix, ignoring case:
Google(ICMP),Google_tcp443(TCP),Google_h1,Google_h2,Google_h3(HTTP) are all Google.- The DNS wizard's targets,
W_<service>_icmp,_tcp,_h1,_h2and_h3, are all W_<service>.
The link from another dashboard can carry any of these names, including a
probe's full name (Google_h2) or another case (google): the dashboard
strips the suffix itself and shows the whole target.
What the pairing cannot do:
- A target added with a different name on another probe (for example
googfor ICMP andGoogle_h2for HTTP) shows up as two entries. Give related targets the same base name when you add them. - An IPv6 twin has its own name (
Google6), so it is its own entry. - Two targets with the same name in one measurement (the same name in two categories, or two names that differ only in case) are drawn together, and their bands mix. Keep names unique.
- The DNS wizard's targets have no DNS layer of their own, so their DNS tile always says "not measured"; the wizard's dashboard covers their DNS.
The dashboard reads InfluxDB. With the ClickHouse backend it is not available yet.