DNS resolver probes
How long a public resolver takes to answer one query, and how often it does
not answer at all. SmokePing's DNS probe sends the query with dig to the
resolver's address and records the time to the answer. This is the Pi
asking a resolver directly; it is not the house's own lookups (that is the
DNS observer) and not which resolver the house's queries
actually reach on the Internet (that is
Which resolver answers).
What is measured
The install seeds three resolvers, in the dns_resolvers category:
| Target | Resolver | Name looked up |
|---|---|---|
GoogleDNS |
8.8.8.8 | google.com |
CloudflareDNS |
1.1.1.1 | cloudflare.com |
Quad9DNS |
9.9.9.9 | quad9.net |
The probe (DNS in probes.yaml, SmokePing's
DNS probe) runs
/usr/local/bin/dig-usec (a thin wrapper around dig, see below) and
sends 5 queries per target every 300 seconds: each
query is one sample, and a query that gets no answer counts as lost. The
name looked up is the target's lookup; it stays the same from cycle to
cycle, so after the first query the resolver usually answers from its
cache: the time is mostly the path to the resolver, not a full recursive
resolution.
The time is read at microsecond resolution. dig timestamps with the
kernel's coarse clock unless given -u, and on a Pi that clock ticks every
4 ms, so every sample used to be a multiple of 4 ms and a change smaller
than a tick did not show. dig-usec runs dig -u and rewrites the one
line ;; Query time: N usec to ;; Query time: N.NNN msec, which is the
form SmokePing's DNS probe parses; everything else dig prints, and its
exit code, pass through. It sends the same queries as before and the
series keep their names.
One change in the history. From the release that introduced the
wrapper, the DNS series are no longer quantized: a resolver that answered
in 4 ms, 8 ms or 12 ms now shows 3.6, 7.9, 11.2. Medians and minimums move
by up to one tick (a few ms at most) at that point, with no change in the
network. On upgrade, every installed probe whose binary is /usr/bin/dig is
switched to /usr/local/bin/dig-usec, once; a binary you chose yourself
is left alone. The Basic edition uses SmokePing's stock probe
configuration, which still calls dig, so its DNS samples keep the 4 ms
steps. The smokeping and config-manager images change together (an
upgrade pulls both); rolling back to an earlier release needs the DNS
probe's binary set back to /usr/bin/dig.
To measure another resolver, add it in the web admin (Targets → Add) with the probe DNS, the category DNS Resolvers and a name to look up. On Pro, the web admin's Your connection card suggests the resolvers your own network hands out (see Getting started, step 6).
Where the data lands
SmokePing writes these targets under the DNS_Resolvers section, so their
RRDs are in DNS_Resolvers/ (for example DNS_Resolvers/GoogleDNS.rrd).
Both exporters classify by that top-level directory: the section name is
what config_generator.CATEGORY_PRESENTATION emits, and renaming one means
renaming the other. RRDs under the older directory name resolvers/ still
export the same way, so old trees keep their history.
In InfluxDB:
| measurement | dns_latency |
| tags | target (GoogleDNS…), category = dns, probe_type = dns |
ping1..ping5, median |
resolution time, seconds |
loss |
0–1 ratio: the RRD's count of lost queries divided by pings |
pings, step |
queries per cycle (5) and the step in seconds (300) |
uptime |
SmokePing's own data source, written only when the RRD holds a value |
Dashboards multiply the times by 1000 to show milliseconds. In ClickHouse
the rows carry measurement_type = dns_latency and category = dns,
and loss is packet_loss in percent (0–100); see
ClickHouse backend. The category tag is dns, not the
directory name and not the database's dns_resolvers: the two
vocabularies are mapped in common/links.py, and both have consumers.
Dashboards
- DNS Resolvers – Side-by-Side (Resolution Time & Packet Loss), in the
DNS folder: one row per resolver, a Grafana row repeated over the
targetvariable (every target withdns_latencydata in the last 24 hours) and titled with the resolver's name. The left panel is the resolution time in milliseconds — median, mean, p10/p20/p80/p90, min and max of the five samples, with the 15-minute windows that lost queries as bars — and the right one, on the same row, the share of queries lost, so a lossy quarter hour and the resolution time it came with are read together. Individual Pings – Latency & Loss in the Targets folder has the same shape for every other target:
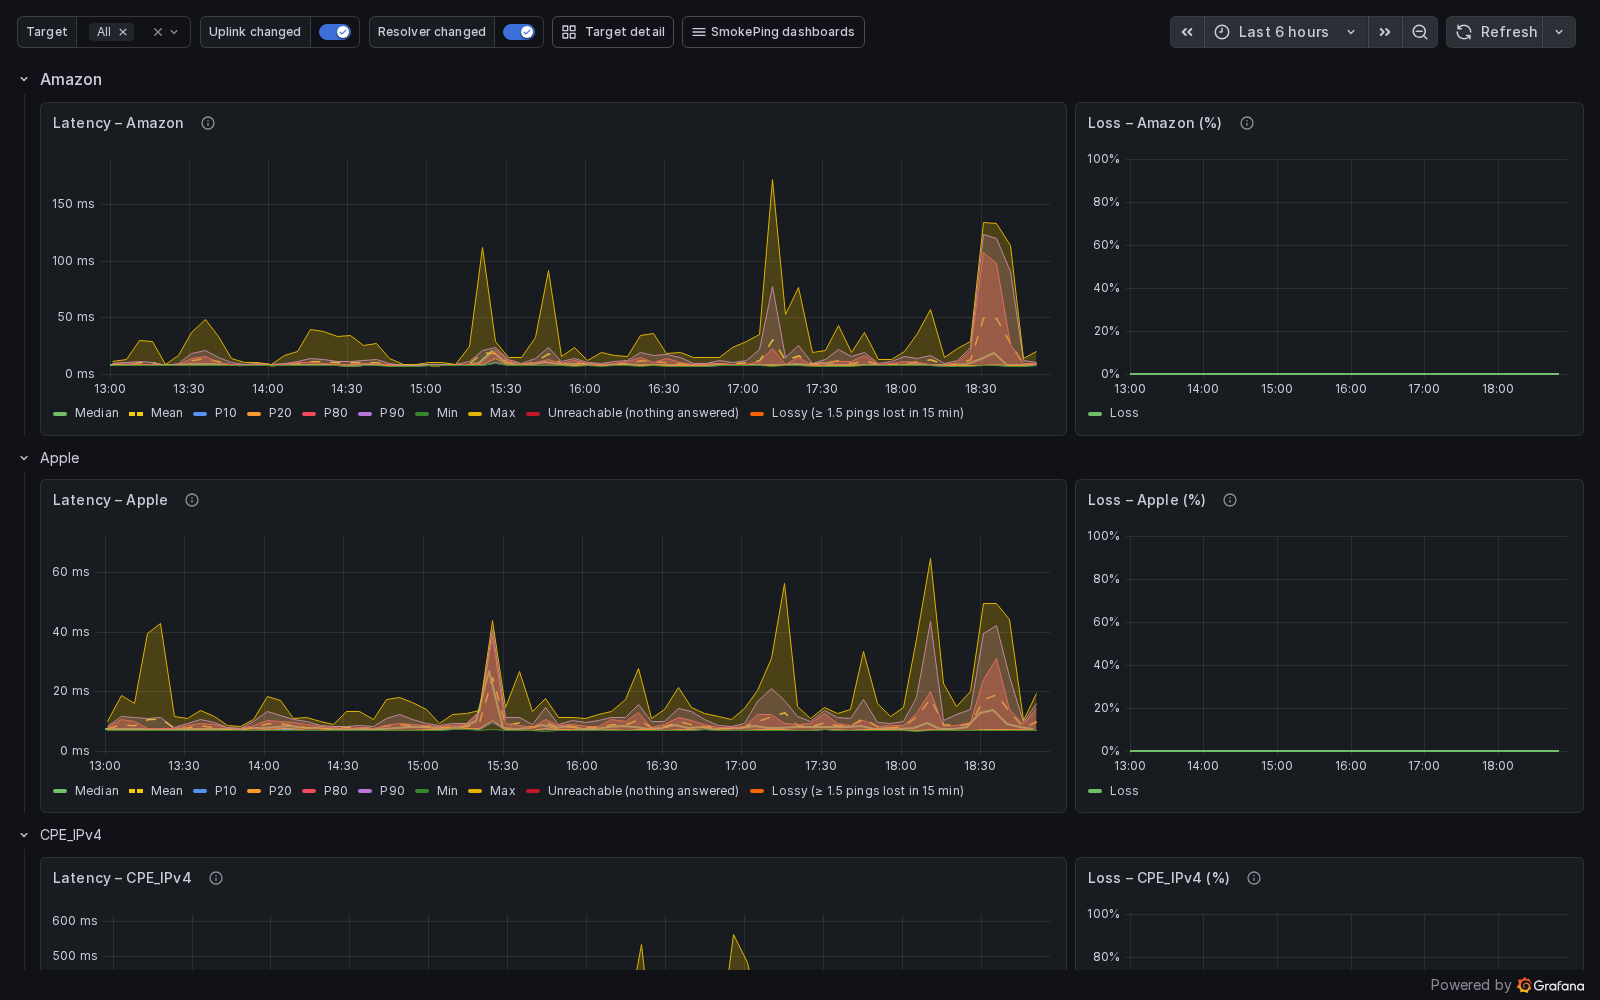 - Target Detail shows a resolver's DNS time next to the
other layers measured for the same target.
When the dashboards are empty
- Is SmokePing measuring? The web admin's Measurements card (or
GET /measurementson the config API) lists every target that has stopped updating or never wrote data. A resolver added a moment ago is waiting until its first 300-second step. -
Does the instrumentation agree with itself?
smoking-pi doctor --liveIt checks, among other things, that every panel queries a measurement and tags the exporters actually write, and that the running containers run the code in the repository.
-
What does SmokePing say?
smoking-pi logs smokepingThe InfluxDB exporter runs in the same container and logs each cycle (
Cycle complete: N points exported); a container that keeps restarting, or a probe error, shows here too. -
Data arrives but every InfluxDB panel is empty. Grafana's InfluxDB token and InfluxDB have diverged. A whole-stack restart checks the token and repairs it when it is the cause:
smoking-pi restart
A resolver missing from the dashboard's dropdown has written no
dns_latency point in the last 24 hours: check it on the Measurements
card first. A time range shorter than one step (5 minutes) can also show
nothing.
Reading the numbers
- Loss on one resolver only is that resolver or the path to it; loss on all three at once is the connection, and the ICMP targets will show it too.