Measurement budget
Every target you add costs something: packets on your uplink, load on the server at the other end, CPU on the Pi. One target is nothing. The DNS wizard adopting 60 services over ICMP, TCP and three HTTP versions is not nothing. The measurement budget makes that cost visible before it is a surprise on a metered connection.
It reports what the configured measurements cost against two ceilings, and refuses a change that would push the cost past one (Admission). It never throttles, defers or drops what is already measured.
The command
sudo smoking-pi budget
Standard and Pro (it reads config-manager's generated SmokePing config; Basic has no config-manager). On the shipped seed:
probe          class    targets  step pings  samples/h    MB/day
CurlHTTP3      Curl           3   300     3        108      46.7
CurlHTTP1      Curl           3   300     3        108      32.4
CurlHTTP2      Curl           3   300     3        108      32.4
FPing          FPing          6   300    10        720       2.9
DNS            DNS            3   300     5        180       1.3
TCPPing        TCPPing        3   300     5        180       0.9

21 targets: 1404 samples/h of 20000 (7.0%), ~117 MB/day of 1000 (11.7%).
Approximate: SmokePing measurements only, from the generated config.
Most expensive first: what to cut is at the top. --json prints the
same report as JSON, which is also what the API returns:
GET /budget on config-manager (token-protected like the rest of it).
On the dashboard
The web admin's dashboard (Standard and Pro) shows the same report as the Measurement budget card: how much of each ceiling is used, the headroom left, and every probe, most expensive first. The bar turns yellow at 75% of a ceiling and red over it, and an over-budget card says what brings it back. The Bandwidth Usage card at the top shows the daily total and its average rate, and the Probes page shows each probe's MB/day, both from this report.
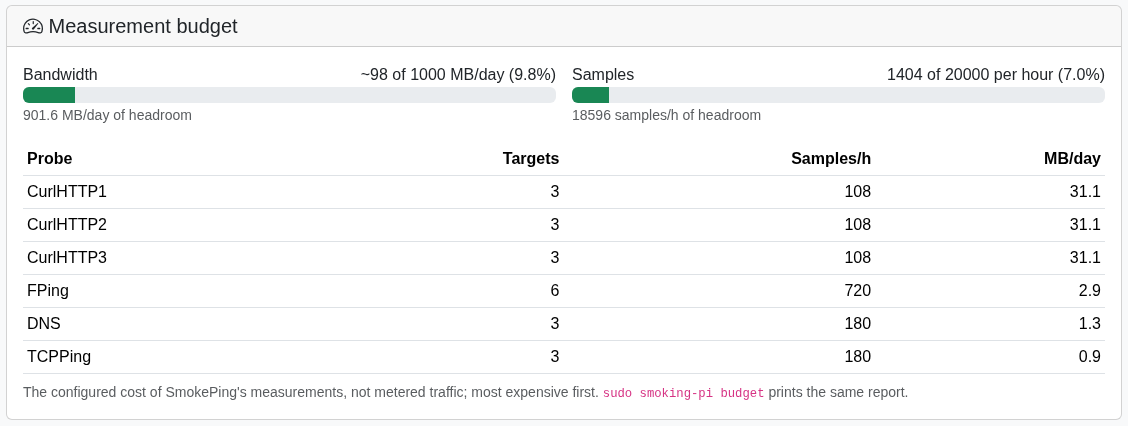
Both figures are the configured cost of what SmokePing runs, not metered traffic. When config-manager cannot be asked, the card says so instead of guessing.
In Grafana
On Pro with InfluxDB, the Overview dashboard (Grafana's home page) has a Measurement budget row. It shows MB/day and samples per hour per probe, stacked, with the ceiling as a dashed line, plus how much of each ceiling is used now. A step in the stack is a change in targets or cadence, such as a DNS wizard adoption, a new target or a shorter step. That is how you see when the cost moved and why.
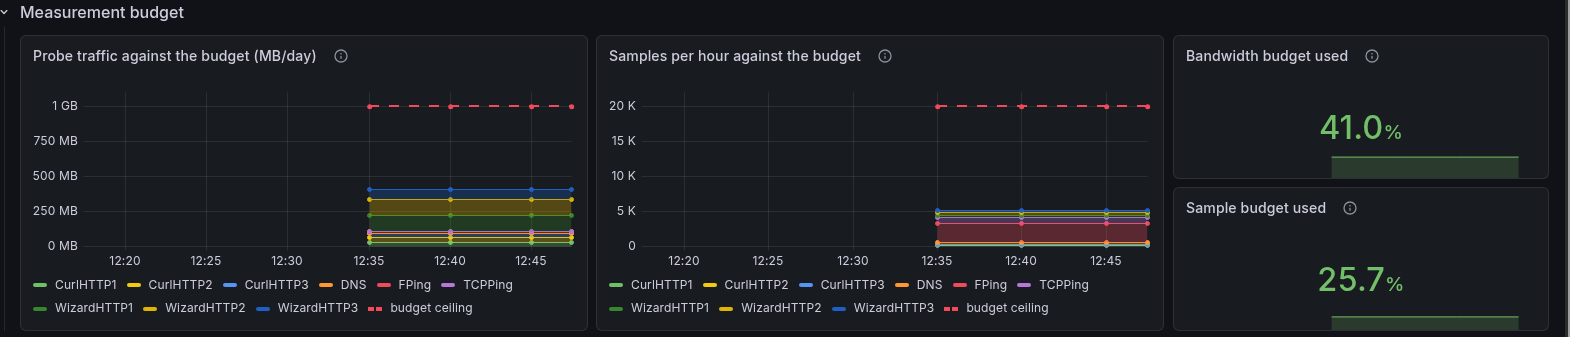
The series comes from measurement_budget.py in the SmokePing container.
Every five minutes it reads config-manager's /budget (the same report as
the command and the card) and writes measurement_budget (the totals and
the ceilings) and measurement_budget_probe (one point per probe, tagged
probe and probe_class). A probe with no measured cost has no
mb_per_day field rather than a zero. ClickHouse installs have no
Overview dashboard and get the web admin card only.
What it counts
What SmokePing runs, read from the same files SmokePing loads: the
generated Targets and Probes, the CPE targets cpe_discovery.py
writes, and the Database defaults. A probe's samples per hour are
targets × pings × 3600 / step. Disabled targets and IPv6 targets gated
out by IPv6 gating are not in the generated file, so
they cost nothing and are not counted.
The bytes are per sample, both directions, IP headers included, and were measured rather than derived:
| class | bytes per sample | what one sample is on the wire |
|---|---|---|
FPing |
168 | an echo request and its reply (fping's default 56 data bytes) |
FPing6 |
208 | the same over IPv6 |
DNS |
300 | one lookup: ~80 bytes up, 80–165 down with dig's EDNS cookie |
TCPPing |
200 | SYN, SYN/ACK, and the kernel's RST |
Curl, HTTP/1.1 and HTTP/2 |
12,500 | one HEAD over TLS 1.3: the certificate chain, the response headers and curl's lookup of the name (9–17 KB across 23 sites, 12.5 KB on average) |
Curl, HTTP/3 |
18,000 | the same HEAD over QUIC (15–22 KB, 17–18 KB on average): every client Initial is padded to 1200 bytes, and QUIC sends its own acknowledgments |
A probe of a class with no measured cost (a probe you added yourself) is counted in samples and listed as unpriced, so the MB/day figure is not read as complete.
The path meter, when it is on, adds a Traceroute row of class
Path. Its rate is not configured but measured: the probes its cycles of
the last day sent, on average per hour, 110 bytes each (a 44-byte ICMP probe and a reply of about
the same size). Its targets are the distinct addresses it traced, and
they are not added to the targets total. A path meter that has not
finished a cycle in three intervals has no row.
Its traces during a loss episode (path meter)
are reserved as an EpisodeTraces row at their worst case: the hourly cap
(PATHMETER_EPISODE_TRACES_PER_HOUR) times the probes a round trace costs,
whether an episode is under way or not, so admission keeps room for them.
The row appears with the first check after the path meter starts; set the cap to 0 and it goes at the next hourly cycle.
Nearly all of the seed's bandwidth is TLS handshakes: an HTTP sample costs
70 to 110 times an ICMP one. That is why the HTTP probes send HEAD. Before
they did, each sample downloaded the whole home page, and the same seed
cost about 6 GB a day (HTTP probes).
The ceilings
| setting | default | |
|---|---|---|
MEASUREMENT_BUDGET_MB_PER_DAY |
1000 | about 30 GB a month |
MEASUREMENT_BUDGET_SAMPLES_PER_HOUR |
20000 |
Both are in .env.template; set them with
sudo smoking-pi config set MEASUREMENT_BUDGET_MB_PER_DAY 500. An empty,
malformed or non-positive value falls back to the default: a typo does not
switch the check off. Over either ceiling, the report says so and what
brings it back: fewer targets, fewer pings, or a longer step
(Measurement frequency).
The defaults are deliberately generous: the seed uses 12% of the bandwidth and 7% of the samples. A DNS wizard adoption of 60 services over HTTP/1.1, 2 and 3 alone is about 2.2 GB a day, and shows as over budget.
Measured traffic
Everything above is an estimate: the configured probes times a cost per
sample measured once. Pro also runs a meter. Every five minutes the
uplink_traffic exporter reads the kernel's byte counters
(/proc/net/dev) for the interface the default route leaves through, the
same uplink the Wi-Fi panels use, and keeps the last 24 hours.
smoking-pi budgetadds a line:Measured on wlan0: ~1450 MB/day (1200 MB in, 250 MB out over the last 24.0 h), ...- The dashboard's budget card shows it as a bar against the same ceiling, and the top Bandwidth Usage card adds it under the estimate.
- Grafana's Overview draws it as the solid line on Traffic against the
budget (MB/day), over the stacked estimate and under the dashed
ceiling. The series is
uplink_traffic(taginterface; fieldsrx_bytes,tx_bytes,seconds,mb_per_day).
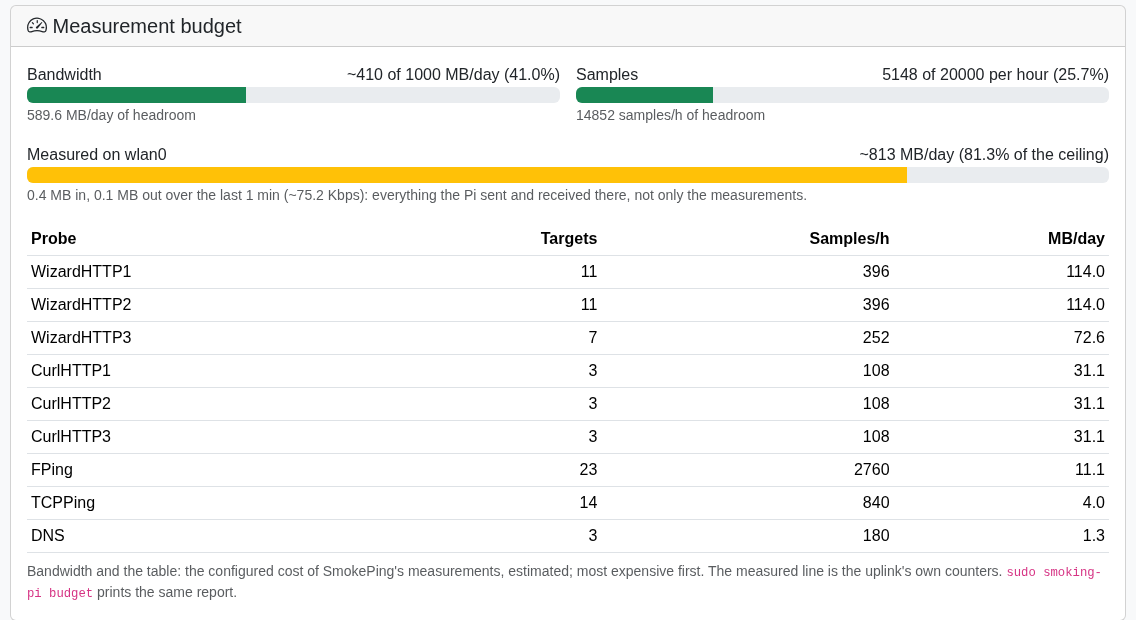
A test Pi with the DNS wizard's HTTP targets: the estimate says 410 MB/day, and the meter, here only a minute old, says about twice that. Ten minutes after an upgrade it read ~524 MB/day: a short window catches the probes' bursts, which is why under an hour of data is gray.
The meter counts everything on that interface, not only the measurements. That is its point: the gap between the two lines is what the Pi spends on other things. It includes:
- the microcut detector's pings to the CPE: 50 every 30 seconds to its
IPv4 address, about 24 MB a day, and as many again to its IPv6 one when
it has one (the netmeter counts them under
smokeping, whose container runs the detector); - LAN traffic on the same link: you opening Grafana or the web admin, and the DNS observer answering the house when the router forwards DNS to it;
- the stack's own downloads: image pulls on an upgrade,
apt; - anything else on the host: an assistant, the Cloudflare tunnels, a VPN's encapsulated traffic.
mb_per_day scales the hours covered to a day, so a meter that started an
hour ago already reads as a daily figure; the card and the command say how
many hours it rests on. Under an hour it is shown but not judged: no
percentage of the ceiling and a gray bar, since one image pull in the
first five minutes would read as hundreds of times the budget. When the
uplink changed interface during the day, both are named.
When a VPN owns the default route (a Tailscale exit node, WireGuard), the interface metered is the tunnel: the figure is the traffic inside it, not what leaves the radio. An interval is dropped, not guessed, when a counter went backwards (a reboot), the uplink changed interface, or the exporter was stopped for more than 15 minutes. A meter that stopped writing for 15 minutes is shown as stale. Basic and Standard have no meter. Which service sends what is the next section.
By service
The meter above says how much; Pro also says who. The netmeter
container counts the same uplink per service, exactly, with nftables
counters keyed on each container:
- Host-network services (SmokePing and its exporters, the DNS observer, the alerter, the MCP server, mdns) by the cgroup of the socket that sends or receives. A connection's first packet also stamps it (one byte of the conntrack mark, bits 24-30, clear of Tailscale's), so the replies, ICMP echo replies included, count for the same service.
- Bridged containers (Grafana, the web admin, ai-insights, InfluxDB, PostgreSQL, config-manager) by their address, where their traffic is forwarded to the uplink.
- host: everything else on the uplink that no container sent or received (apt, an assistant, sshd, Docker pulling an image).
- other_containers: forwarded traffic of containers this stack does
not name, such as a tunnel started by hand with
docker run.
smoking-pi budget lists them after the measured line, most traffic
first. The dashboard's budget card has a Measured by service table,
and Grafana's Overview has Measured traffic by service (MB/day),
stacked. The series is service_traffic (tags service and kind:
host_network, bridge or rest; fields rx_bytes, tx_bytes,
seconds, mb_per_day).
On a test Pi, ten minutes after an upgrade, smoking-pi budget read
(the uplink meter said ~524 MB/day over the same time):
By service, over the last 10 min (not yet a daily figure):
  smokeping          ~   463.7 MB/day  (2.3 MB in, 1.0 MB out)
  host               ~    37.4 MB/day  (0.1 MB in, 0.1 MB out)
  other_containers   ~     2.4 MB/day  (0.0 MB in, 0.0 MB out)
  grafana            ~     1.1 MB/day  (0.0 MB in, 0.0 MB out)
  mdns               ~     1.1 MB/day  (0.0 MB in, 0.0 MB out)
  dns-observer       ~     0.7 MB/day  (0.0 MB in, 0.0 MB out)
The services add up to ~506 MB/day against the interface's ~524. The two were read over slightly different windows (the uplink meter's was a minute longer), and the interface also counts link-layer overhead that the per-container counters do not, so a few percent of difference is expected.
Checked against the estimate. Over 14.6 steady hours on the same
Pi (40 HTTP probes from the DNS wizard and the seed, a third of them
HTTP/3), the meter put smokeping at ~528 MB/day and the whole uplink at
~559. The estimate, with HTTP/3 priced like HTTP/2, said 410: 29% short.
Measuring each probe's HEAD on its own (the same curl command in a
throwaway container, reading that container's byte counters) found the
gap: HTTP/1.1 and HTTP/2 cost what the table said, HTTP/3 about 45% more.
Priced per version, the probes come to ~506 MB/day; with the microcut
detector's ~24 that is ~530, within 1% of what the meter counted.
What it changes on the host. It adds one table, inet
smoking_pi_meter, with three chains (output, input, forward) at
priority -150. They hold counters and a conntrack mark and nothing else:
no rule drops, accepts, rejects or rewrites a packet, so whatever the
host's firewall (Docker's, Tailscale's, yours) decided before, it still
decides. Stopping the container removes the table. NETMETER=off in the
env file loads nothing. To look at it: sudo nft list table inet
smoking_pi_meter.
The container runs with CAP_NET_ADMIN and no other capability, on the
host network and in the host's cgroup namespace (nft resolves a cgroup
by its path), on a read-only filesystem. It asks config-manager which
container is which (GET /meter/containers) rather than holding the
Docker socket. A container that restarts gets a new cgroup, even with
the same container id (docker restart), and nft keys a rule on the
cgroup itself, not its path; the meter watches each cgroup's identity
and reloads the table within a minute, keeping what the counters held.
Each host-network service keeps its own mark number across reloads, so a
long-lived connection is never credited to another service.
Limits worth knowing:
- The uplink is a physical interface (one with a device:
wlan0,eth0) unlessNETMETER_INTERFACESnames it. An uplink that is a bridge, a bond, a VLAN or PPPoE needs that setting; without it the meter says so in its status and counts nothing. - A VPN's encrypted packets leaving the uplink (tailscaled, WireGuard)
are counted as
host, not as the service whose traffic they carry. - Inbound multicast (mDNS questions to the mdns service) is not tied
to a socket on the way in and is counted as
host; what mdns sends is counted as mdns. - The conntrack mark bits 24-30 stay on the connections that carried
them until those connections end, even after the table is removed. A
firewall of your own that copies the whole conntrack mark into the
packet mark without a mask (some multi-WAN or policy-routing setups)
would see them; Docker and Tailscale do not do this.
NETMETER=offif yours does.
Bandwidth
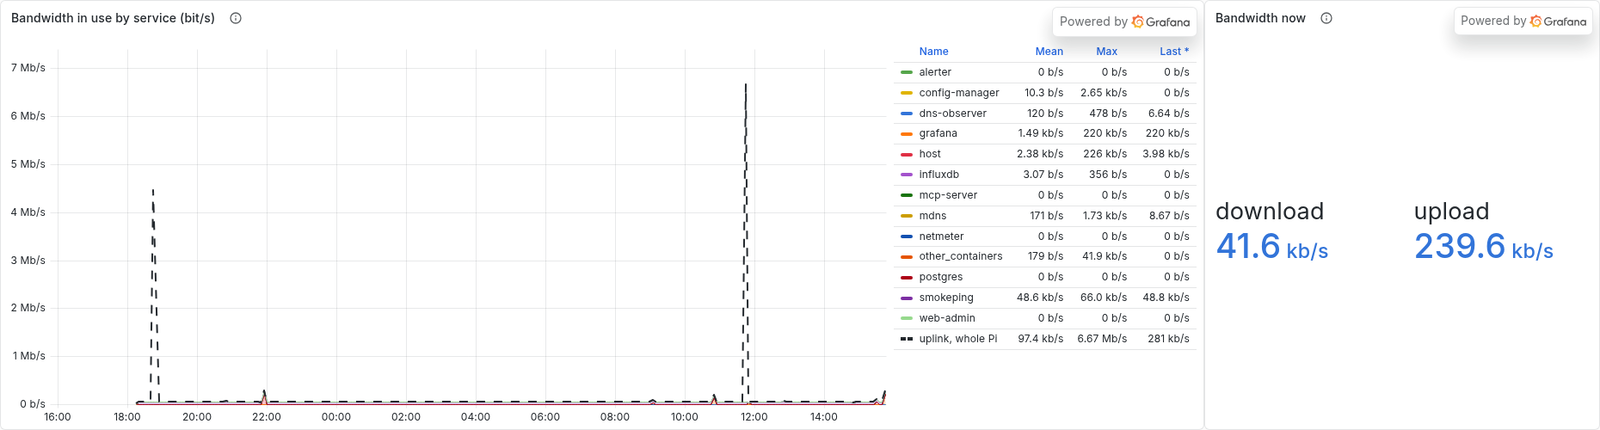
MB/day answers "how much"; the Overview's Bandwidth in use by service (bit/s) answers "how fast, right now": the same counters as a rate. For each window it divides the bytes counted (both directions, times eight) by the seconds counted, per service, stacked, with the uplink meter (the whole Pi) as a dashed line. Bandwidth now, beside it, is the uplink's last five-minute interval, download and upload apart. Units are decimal (1 Mb/s = 10^6 bits per second), as ISPs quote a link's speed.
Every point is an average over at least one five-minute interval, the counters' resolution: a burst of a few seconds (a page load, an image pull) is spread over its interval, so the chart shows the load the Pi puts on the link, not its peak. A window with less than a minute counted is left out: a restart leaves a sub-second interval behind, and a rate over it would be noise. On a test Pi, SmokePing ran at ~50 kb/s around the clock, and the busiest five minutes of the day reached ~6.7 Mb/s on the uplink line.
Traffic accounting
The meters above give a rate; Pro also keeps a ledger: what the Pi sent and received per day, so you can ask how much it has spent in the periods a data plan is billed in.
sudo smoking-pi traffic
Traffic on wlan0 (local time, America/Chicago), measured since 2026-09-30, Internet only since 2026-10-01.

                received       sent      total  covered   Internet  covered
today             450 MB     150 MB     600 MB     100%     520 MB     100%
yesterday         900 MB     300 MB    1.20 GB     100%    1.05 GB     100%
this week        1.75 GB     550 MB    2.30 GB      44%    1.57 GB      33%
this month       1.35 GB     450 MB    1.80 GB     100%    1.57 GB     100%
last month        400 MB     100 MB     500 MB       2%          -        -
last 30 days     1.75 GB     550 MB    2.30 GB       7%    1.57 GB       5%

received/sent/total: everything on the interface, the local network included.
Internet: the same without traffic to and from the local network (what a data plan counts).
covered: how much of the period each meter was running; nothing is extrapolated.

This month by service:
  smokeping             1.43 GB  (1.05 GB in, 380 MB out)
  host                   215 MB  (200 MB in, 15 MB out)
  grafana                 12 MB  (10 MB in, 2.0 MB out)
  dns-observer           5.5 MB  (3.0 MB in, 2.5 MB out)
An example: the uplink meter started on 30 September, half a day before the month ended, and the netmeter a day later. Hence the low coverage for last month, the week and the 30 days, and the Internet column's own.
- Two figures. total is everything on the uplink interface, as the
uplink meter counts it. Internet is the netmeter's count of the same
interface without the traffic whose other end is on the local network:
private addresses (
10/8,172.16/12,192.168/16,fc00::/7), link-local (169.254/16,fe80::/10), multicast, broadcast and the unspecified addresses (0/8,::). That is what an ISP's data cap sees. The difference is the LAN: you opening Grafana or the web admin, the DNS observer answering the house, mDNS. A LAN numbered from public space (a global IPv6 prefix on the LAN) counts as Internet, and so does carrier-grade NAT space (100.64/10), which is the ISP's. - Local dates. Days, weeks (Monday to Sunday) and months follow the
stack's
TZ. An interval that straddles midnight counts for the day it ends in, at most five minutes on the wrong side. - covered says how much of the period each meter was running, the Internet column its own (the netmeter can start later, or be off). A reboot loses one five-minute interval (the kernel's counters start again from zero); a stopped container loses what it did not see. The figures are what was counted, never extrapolated: at 90% covered, the real figure is about a tenth higher. Days follow real time, so a daylight-saving day is 23 or 25 hours.
- Internet against total. The two come from different counters: the
total is the interface's (
/proc/net/dev, which also counts link-layer headers and ARP), the Internet figure the netmeter's (IP packets). So even traffic that is all Internet reads a few percent lower in the Internet column, and in a period where the netmeter covered more than the uplink meter, the Internet figure can exceed the total: compare them at equal coverage. - Kept 400 days per day, so this month can be set beside the same
month a year ago; services per month, for 25 months (per day they
would more than double a file rewritten every five minutes on an SD
card). A day dated before 2020 (a Pi without a real-time clock, before
it synced) or after tomorrow is not counted. Each meter keeps the
previous copy of its file (
.bak) and, if it finds its file damaged, sets it aside as.corruptand goes on from the copy. The ledger lives in the meters' state files (uplink_traffic.jsonin SmokePing'ssmokeping-configvolume,state.jsoninnetmeter-state), so it works with ClickHouse as well as InfluxDB and survives losing the time series.smoking-pi backupcopies both volumes. --jsonprints the report; the API isGET /trafficon config-manager. With InfluxDB, the netmeter also writesinternet_traffic(fieldsrx_bytes,tx_bytes,seconds,mb_per_day) besideservice_traffic.
The web admin's dashboard has the same figures in a Traffic card, below the budget card, and the top Bandwidth Usage card adds this month's total:
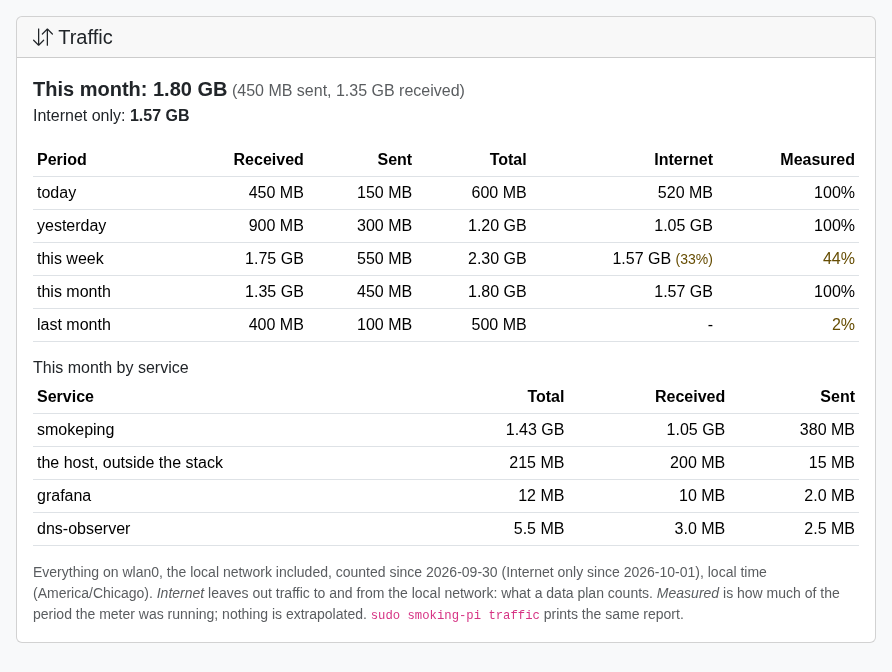
Sample data. A period measured for less than 99% of its time shows its coverage in amber, and the Internet column shows its own when the netmeter covered less.
Grafana's Overview has a Traffic row (InfluxDB): received and sent
per day over the last 30 days with the Internet-only part as a line, this
month so far and last month (the interface's total and the Internet
part), and each service's traffic per calendar month over the last 12.
They sum the same five-minute series (uplink_traffic,
internet_traffic, service_traffic), so they work back to when the
meters started, not only since the ledger; but they say nothing about
coverage: a gap is simply a shorter bar. Days and months there follow
the dashboard's time zone (your browser's by default), the card and the
command the Pi's TZ; near midnight the two can split a day differently.
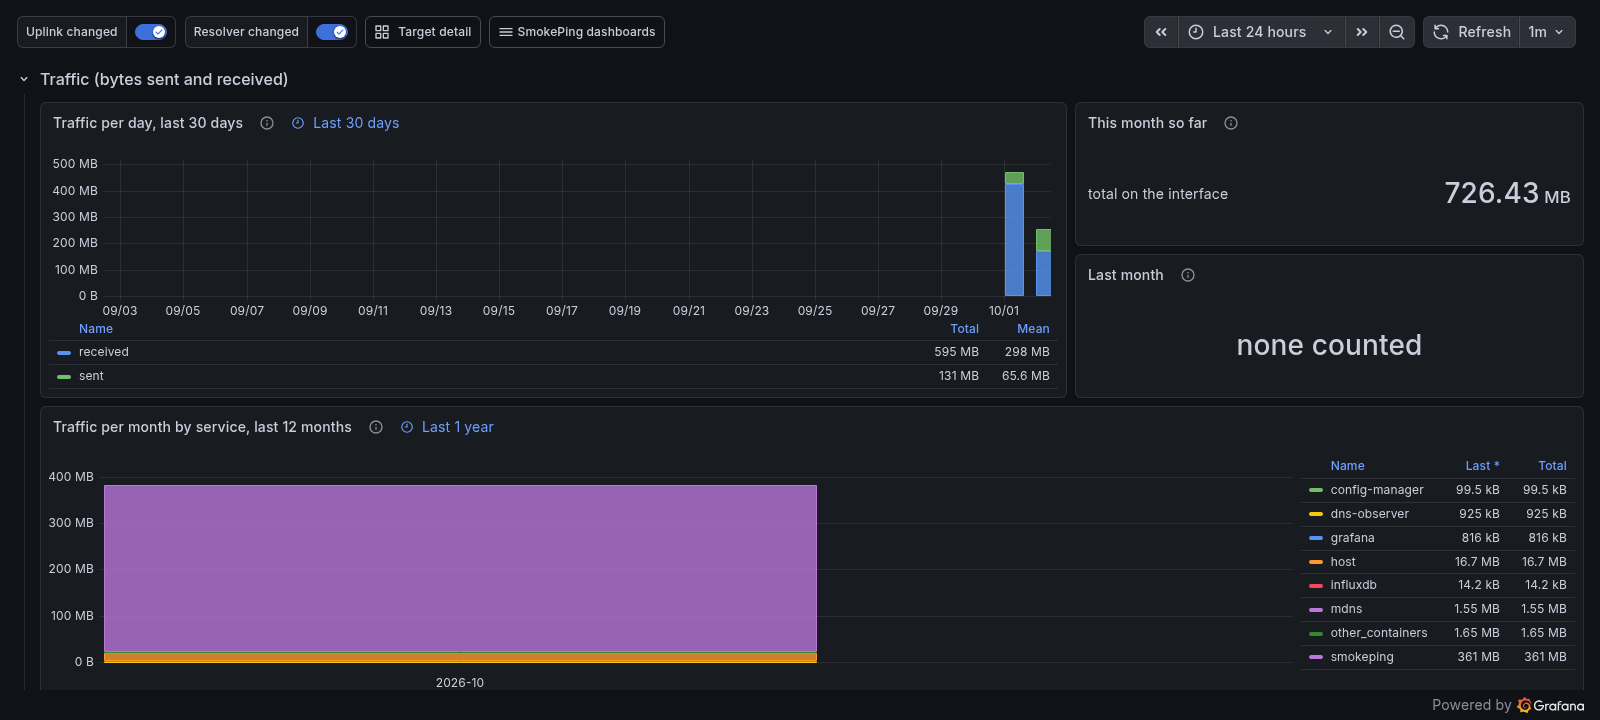
A test Pi two days after its meters started: hence one month, two days, and nothing last month. The Internet line and figure are missing because that Pi's netmeter predated them.
Basic and Standard have no meters; smoking-pi traffic says so, and the
card says there are no figures yet. With ClickHouse, the command and the
card work (the ledger is in the state files) and the Grafana row does
not (the meters write their series to InfluxDB only).
What it does not count yet
The estimate leaves out measurements outside SmokePing, which do not grow with the target list (the meter above sees them):
- The CPE microcut detector (Pro, InfluxDB): 50 pings to the CPE
(the ISP's first hop, which
cpe_discoveryfinds) every 30 seconds, per address family, about 144,000 a day each, or ~24 MB/day over IPv4 and ~30 MB/day over IPv6. That hop is past the router, so the pings cross the uplink and the netmeter counts them undersmokeping, as Internet traffic when the hop has a public address. It is the largest single source of packets on the box. - Resolver identity and the public address (Pro, InfluxDB): a few DNS lookups every 15 minutes, well under 1 MB a day.
- The DNS observer's canary: one lookup through the router every five minutes, and a self-test against itself on the Pi.
- On-demand checks: the DNS wizard's pre-flight,
smoking-pi dns test, the OCA refresh.
Admission
A change that adds cost is priced before it is saved, against the budget as it stands:
- adding a target, or turning one on;
- moving a target to a costlier probe;
- a shorter step or more pings on a probe (priced for each of its active targets);
- a DNS wizard adoption (its new targets, net of the layers it deactivates in the same run).
If the totals after the change would cross either ceiling, the change is
refused and nothing is saved. The API answers 409 with reason:
over_budget, the cost requested, the totals now and after, the
ceiling and the headroom, and a message for a person. The web admin,
the assistants and the CLI show that sentence.
- To add it anyway, repeat with force:
?force=1on the API,smoking-pi dns adopt --force. - To make room, raise a ceiling (above) or cut something (Measurement frequency).
smoking-pi dns adopt --dry-run says whether the adoption fits before
anything is tried: "Fits the measurement budget.", the refusal it would
get, or that the budget could not be read (then adopting is not refused
for it).
A guardrail, not a lock: the budget is read from the generated files as SmokePing last loaded them, so two changes sent at the same moment can each fit on their own and cross a ceiling together. A refusal names only the ceilings the change adds to: with samples already over, a change that adds bytes but no samples is judged on bytes.
What is never refused:
- a change that lowers the cost (removing or turning off a target, a longer step), even with the budget already over;
- a target added turned off;
- any change when the budget cannot be computed: no generated files yet, or an error reading them. Admission never blocks on its own failure.
Not admitted, because they set the configuration rather than add to it:
PUT /config/targets (a whole YAML file), the first-run seed, and the
nightly Netflix OCA refresh, which updates its slots in place.
What comes next
From the roadmap, in order:
- Scheduling within the budget: when the requested set exceeds it, reduce cadence, samples or targets, with deterministic rotation so the whole set is eventually covered, and report requested vs admitted vs deferred. Today admission refuses at the door instead.
- Per-destination limits (service, prefix, ASN) so a large discovered target set does not turn into concentrated probing of one operator.
- The DNS wizard asking this budget instead of keeping limits of its own. The path meter is counted, but enabling it is not admitted against the ceilings yet.