🐞 Jitterbug
A Python framework for inferring Internet path congestion from Round-Trip Time (RTT) measurements. Jitterbug splits an RTT time series at change points, then classifies each period as congested or not by combining a latency-jump test with a jitter test (jitter dispersion or Kolmogorov–Smirnov). It implements the method from Jitterbug: A New Framework for Jitter-Based Congestion Inference (PAM 2022) and ships the paper's dataset so you can reproduce it in one command.




✨ Features
- 📉 Congestion inference from RTTs alone: no active probing beyond the pings you already have
- 🔀 Pluggable change point detection:
rupturesout of the box, the paper's Bayesian detector (bcp) as an extra - 📐 Two jitter tests: jitter dispersion (moving IQR + moving average) or a Kolmogorov–Smirnov test between periods
- 🧩 Non-sequential mode: cluster 15-minute intervals by (latency, jitter) with a Gaussian mixture or k-means and compare each cluster with the baseline, no matter when its intervals occur
- 📁 Multiple input formats: CSV, scamper JSON, and InfluxDB queries
- 📊 Rich terminal output: summary and per-period tables, plus JSON or CSV results files
- ⚙️ Typed configuration: Pydantic models, YAML/JSON config files,
JITTERBUG_*environment variables - 🧪 Reproducible: the PAM 2022 dataset (47 163 measurements) and its reference results are bundled
- 🐍 Library and CLI: use
jitterbug analyzeor callJitterbugAnalyzerfrom your own code
🚀 Quick Start
Installation
From PyPI:
pip install jitterbug-inference              # core: ruptures detector, CLI, library
pip install "jitterbug-inference[bcp]"       # + the paper's Bayesian detector
The distribution is named
jitterbug-inferencebecausejitterbugon PyPI is an unrelated project; the import isimport jitterbugand the command isjitterbug.pip install jitterbuginstalls the wrong package.
For development, clone and use uv:
git clone https://github.com/estcarisimo/jitterbug.git
cd jitterbug
uv sync
source .venv/bin/activate   # or prefix every command below with `uv run`
See docs/INSTALLATION.md for pip from a clone, pinned versions and troubleshooting.
Optional back ends
| Extra | Installs | Use it for |
|---|---|---|
bcp |
bayesian-changepoint + torch | The Bayesian detector used in the paper, and the online mode (jitterbug stream / replay) |
clustering |
scikit-learn | The non-sequential mode (--mode clustering) |
influx |
influxdb-client | Loading RTTs straight from InfluxDB |
zstd |
zstandard (not needed on Python 3.14+) | Reading and writing .zst-compressed files |
visualization |
matplotlib | jitterbug visualize and the plotting helpers |
jupyter |
JupyterLab, ipykernel | The notebooks in examples/ |
all |
everything above |
pip install "jitterbug-inference[bcp,visualization]"   # the paper's setup plus figures
uv sync --extra all                                     # from a clone: everything
System requirements
- Python 3.10 or higher
📖 Usage
Analyze a file
# Print the summary and the congestion periods found in the bundled dataset
jitterbug analyze examples/network_analysis/data/raw.csv

# Save the full results
jitterbug analyze examples/network_analysis/data/raw.csv --output results.json

# Reproduce the paper: Bayesian change points + KS test (needs `uv sync --extra bcp`)
jitterbug analyze examples/network_analysis/data/raw.csv --algorithm bcp --method ks_test

# Non-sequential mode: cluster intervals by (latency, jitter) (needs `--extra clustering`)
jitterbug analyze examples/network_analysis/data/raw.csv --mode clustering

# Only the summary table
jitterbug analyze examples/network_analysis/data/raw.csv --summary-only

# CSV instead of JSON (Parquet is also supported if `pyarrow` is installed)
jitterbug analyze rtts.csv --output results.csv --output-format csv

# Zstandard-compressed input and output: a trailing .zst is enough (needs the `zstd` extra
# before Python 3.14)
jitterbug analyze rtts.csv.zst --output results.json.zst
Validate input before analyzing
jitterbug validate rtts.csv --verbose
Plot the analysis
# Five PNG figures (raw RTT, minimum RTT, change points, verdicts, confidence) at 300 dpi;
# needs `uv sync --extra visualization`
jitterbug visualize examples/network_analysis/data/raw.csv --output-dir plots
The figures are described in docs/VISUALIZATION_USAGE.md, together with the JitterbugPlotter API for your own scripts.
Online mode: stream and replay
# Infer congestion as samples arrive: `epoch,rtt` lines on stdin, one JSON event per line;
# needs `uv sync --extra bcp`
my-probe | jitterbug stream --events verdicts

# Replay a recorded dataset through the online pipeline and score it against a reference
jitterbug replay examples/network_analysis/data/raw.csv --method ks_test \
  --reference examples/network_analysis/expected_results/kstest_inferences.csv
On the paper dataset congestion onsets are reported 15 min after they start (median; 90 min at most); see docs/ONLINE_MODE.md for the method, the results on the paper dataset and the streaming configuration section.
Configuration files
# Write a template with every option and its default
jitterbug config --template --output config.yaml

# Use it
jitterbug analyze rtts.csv --config config.yaml
Additional commands
jitterbug version
jitterbug --help
jitterbug analyze --help
Python API
from pathlib import Path

from jitterbug import JitterbugAnalyzer, JitterbugConfig

config = JitterbugConfig()  # or JitterbugConfig.from_file(Path("config.yaml"))
analyzer = JitterbugAnalyzer(config)

results = analyzer.analyze_from_file("examples/network_analysis/data/raw.csv")

for period in results.get_congested_periods():
    print(period.start_timestamp, period.end_timestamp, period.confidence)

summary = analyzer.get_summary_statistics(results)
print(
    f"{summary['congested_periods']} congested periods, "
    f"{summary['congestion_duration_seconds']:.0f} s in total"
)
analyze_from_dataframe(df) accepts a pandas DataFrame with epoch and values columns, and analyze(dataset) an RTTDataset you built yourself.
Input formats
The contract (columns, units, ordering, what is dropped) is in docs/INPUT_FORMATS.md.
CSV: one RTT sample per row, epoch seconds and milliseconds.
epoch,values
1512144010.0,63.86
1512144010.0,66.52
1512144020.0,85.2
scamper JSON (ping records, one per line):
{"type":"ping","src":"192.168.1.1","dst":"8.8.8.8","responses":[{"rtt":1.712,"tx":{"sec":1752855461,"usec":719258}}]}
InfluxDB (uv sync --extra influx):
from jitterbug.io import DataLoader

dataset = DataLoader().load_from_influxdb(
    url="http://localhost:8086",
    token="...",
    org="my-org",
    bucket="network-metrics",
    query='from(bucket:"network-metrics") |> range(start: -1h) |> filter(fn: (r) => r._measurement == "rtt")',
)
🔧 Configuration
Every option lives in a Pydantic model and can be set from a YAML/JSON file or from the CLI flags. jitterbug config --template prints the full set; the important ones:
analysis_mode: sequential      # sequential | clustering (see docs/CLUSTERING_MODE.md)

change_point_detection:
  algorithm: ruptures          # ruptures | bcp
  threshold: 0.25
  min_time_elapsed: 1800       # seconds between change points
  ruptures_model: rbf
  ruptures_penalty: 10.0

jitter_analysis:
  method: jitter_dispersion    # jitter_dispersion | ks_test
  threshold: 0.25
  moving_average_order: 6
  moving_iqr_order: 4
  significance_level: 0.05

latency_jump:
  threshold: 0.5               # minimum-RTT increase (ms) that counts as a jump

data_processing:
  minimum_interval_minutes: 15 # width of the minimum-RTT intervals
  outlier_detection: true
  outlier_threshold: 3.0

clustering:                    # used when analysis_mode is clustering
  algorithm: gmm               # gmm | kmeans | kmeans_silhouette
  min_period_intervals: 2      # temporal smoothing, in intervals
  min_ks_statistic: 0.1        # smallest KS statistic that counts as a jitter change

output_format: json            # json | csv | parquet (parquet needs pyarrow)
verbose: false
Top-level options can also come from environment variables with the JITTERBUG_ prefix:
export JITTERBUG_VERBOSE=true
export JITTERBUG_OUTPUT_FORMAT=csv
How the analysis works
- Minimum-RTT intervals: the raw samples are binned (15 min by default) and the minimum of each bin is kept, which removes most queueing noise.
- Change point detection on the minimum-RTT series marks the boundaries between periods.
- Latency jump: a period is a candidate if its mean minimum RTT rises above the previous period's by more than
latency_jump.threshold. - Jitter test: jitter dispersion (variance of the filtered jitter series) or a KS test of the RTT distributions on both sides of the change point.
- Congestion inference: a period is congested when both tests agree; each result carries a confidence and the evidence behind it.
The clustering mode (--mode clustering) replaces steps 2–3's sequential comparison: intervals are clustered by (minimum RTT, jitter IQR) and each cluster is compared with the lowest-latency one, wherever its intervals fall in time. On the paper dataset the Gaussian mixture recovers all 15 reference congestion periods, plus 2 at the ends of the data where the sequential reference has no verdict. See docs/CLUSTERING_MODE.md.
ruptures and bcp are the two detectors evaluated in the paper; see docs/ALGORITHM_SELECTION_GUIDE.md for when to use which.
🏗️ Architecture
src/jitterbug/
├── analyzer.py             # JitterbugAnalyzer: orchestrates the pipeline below
├── models/                 # Pydantic models
│   ├── rtt_data.py         #   RTTMeasurement, RTTDataset, MinimumRTTDataset
│   ├── analysis.py         #   ChangePoint, LatencyJump, JitterAnalysis, CongestionInference
│   └── config.py           #   JitterbugConfig and the per-stage configs (BaseSettings)
├── detection/              # Change point detection
│   ├── change_point_detector.py   # dispatch on config.algorithm
│   └── algorithms.py       #   RupturesDetector, BayesianChangePointDetector (bcp)
├── analysis/               # Period classification
│   ├── latency_jump_analyzer.py
│   ├── jitter_analyzer.py  #   jitter dispersion and KS test
│   ├── congestion_inference_analyzer.py
│   └── clustering_analyzer.py     # non-sequential mode (GMM / k-means over intervals)
├── streaming/              # Online mode: OnlineJitterbug (Bayesian online change points) and
│                           #   SlidingWindowJitterbug (offline pipeline on a window); replay/score
├── io/                     # DataLoader (CSV, scamper JSON, InfluxDB) and exporters
├── cli/main.py             # Typer CLI: analyze, validate, config, visualize, stream, replay, version
└── visualization/          # JitterbugPlotter (matplotlib): the figures behind `jitterbug visualize`
Bundled data: examples/network_analysis/data/raw.csv is the PAM 2022 dataset, and examples/network_analysis/expected_results/ holds the paper's reference output for both jitter methods.
🧪 Development
# Clone repository
git clone https://github.com/estcarisimo/jitterbug.git
cd jitterbug

# Environment with the dev tools (the `dev` dependency group is installed by default)
uv sync --extra visualization

# Install pre-commit hooks (ruff lint + format on staged files)
uv run pre-commit install
Running tests
uv run pytest
uv run pytest --cov=jitterbug --cov-report=term-missing
uv run pytest tests/test_cli.py -v
The fast suite runs in about twenty seconds and needs no network; the Bayesian regression tests (-m slow) add about two seconds and need the bcp extra. Coverage is about 90 % and CI fails below 75 %.
Code quality
uv run ruff check src/ tests/ examples/ tools/
uv run ruff format src/ tests/ examples/ tools/
uv run mypy src/jitterbug
ruff check, ruff format --check and mypy are all enforced in CI. See CONTRIBUTING.md for the pull request workflow.
Building
uv build
uv pip install dist/*.whl
📊 Example Output
jitterbug analyze examples/network_analysis/data/raw.csv with the default ruptures detector:
📊 Analysis Summary
┌─────────────────────┬────────────┐
│ Total Periods       │ 22         │
│ Congested Periods   │ 11         │
│ Congestion Ratio    │ 24.44%     │
│ Total Duration      │ 1197000.0s │
│ Congestion Duration │ 292497.0s  │
│ Average Confidence  │ 0.90       │
└─────────────────────┴────────────┘

🔍 Congestion Periods
┏━━━━━━━━━━━━━┳━━━━━━━━━━━━━┳━━━━━━━━━━┳━━━━━━━━━━━━┳━━━━━━━━━━━━┳━━━━━━━━━━━━━┓
┃             ┃             ┃          ┃            ┃ Latency    ┃ Jitter      ┃
┃ Start (UTC) ┃ End (UTC)   ┃ Duration ┃ Confidence ┃ Jump       ┃ Change      ┃
┡━━━━━━━━━━━━━╇━━━━━━━━━━━━━╇━━━━━━━━━━╇━━━━━━━━━━━━╇━━━━━━━━━━━━╇━━━━━━━━━━━━━┩
│ 2017-12-02  │ 2017-12-02  │ 27000.0s │ 0.90       │ ✓          │ ✓           │
│ 12:00:10    │ 19:30:10    │          │            │            │             │
│ 2017-12-03  │ 2017-12-03  │ 27000.0s │ 0.90       │ ✓          │ ✓           │
│ 11:45:09    │ 19:15:09    │          │            │            │             │
│ 2017-12-04  │ 2017-12-04  │ 18000.0s │ 0.90       │ ✓          │ ✓           │
│ 14:00:10    │ 19:00:10    │          │            │            │             │
│ ...         │ ...         │          │            │            │             │
└─────────────┴─────────────┴──────────┴────────────┴────────────┴─────────────┘
The dataset shows the daily congestion episodes the paper analyzes. With the Bayesian detector and the KS test (--algorithm bcp --method ks_test) the output matches the reference in examples/network_analysis/expected_results/:
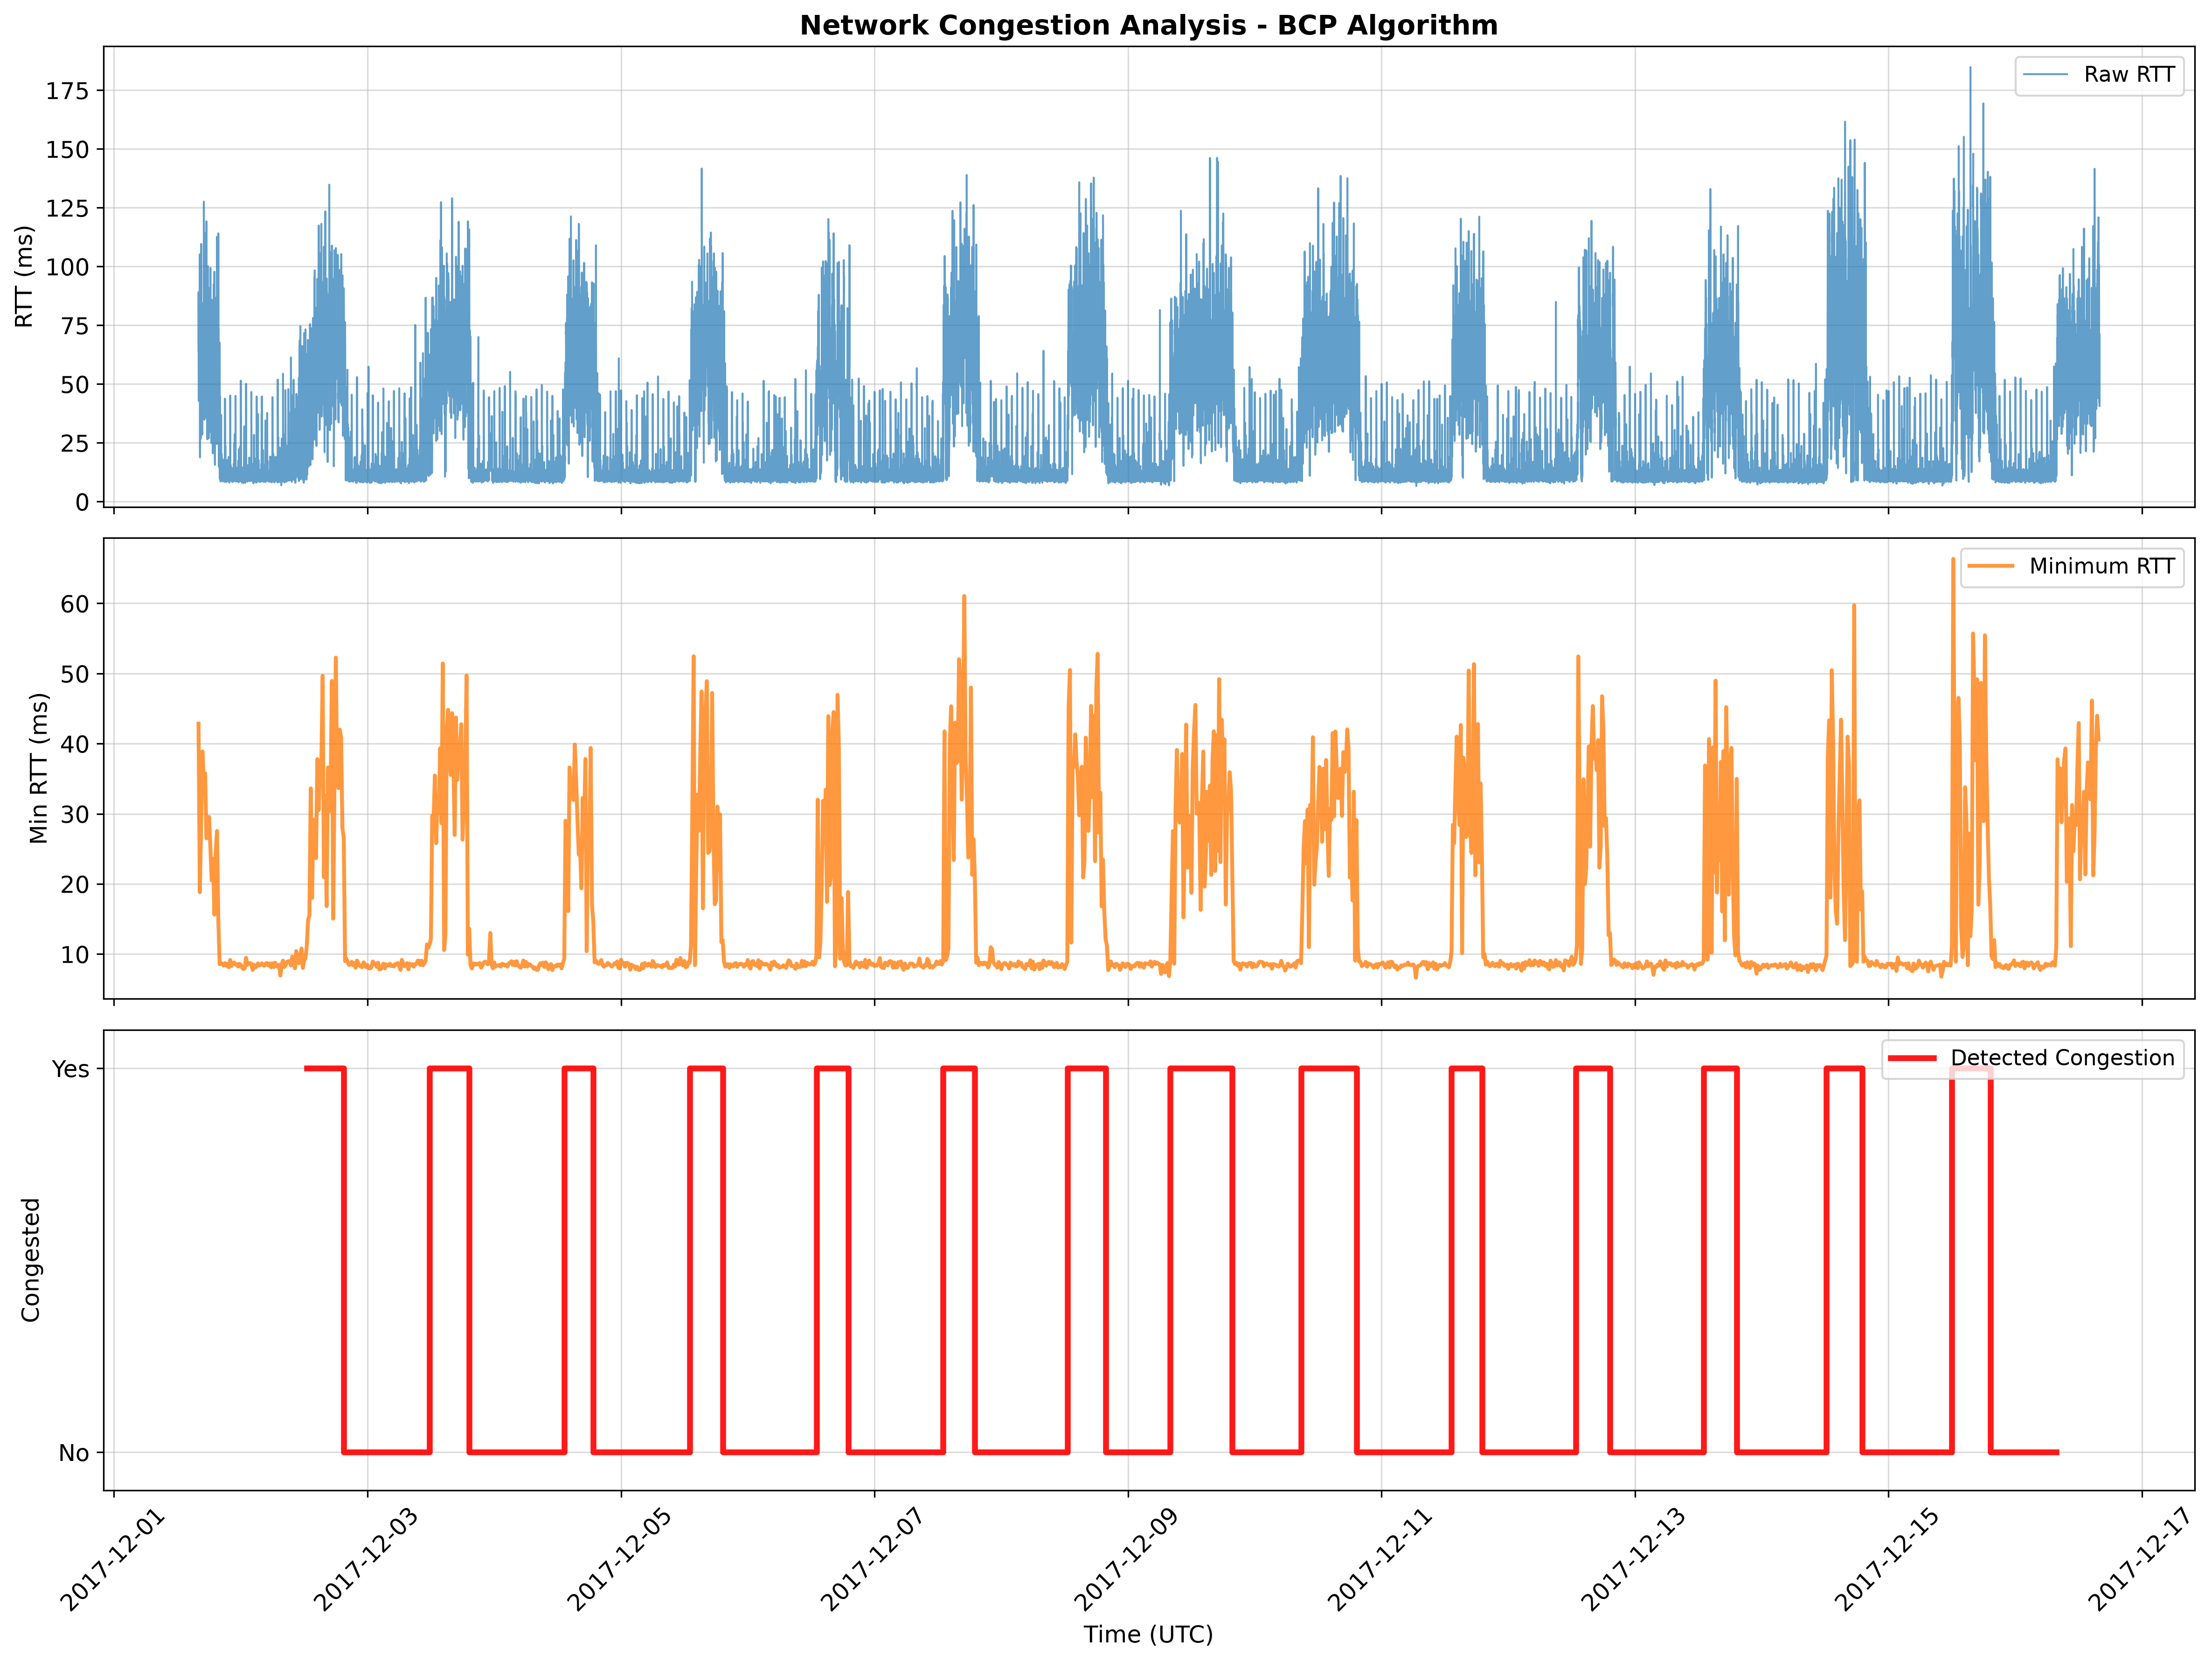
Each entry in results.json carries the period, the verdict, and the evidence:
{
  "start_timestamp": "2017-12-02 12:00:10+00:00",
  "end_timestamp": "2017-12-02 19:30:10+00:00",
  "is_congested": true,
  "confidence": 0.9,
  "latency_jump": {"has_jump": true, "magnitude": 20.62, "threshold": 0.5},
  "jitter_analysis": {"method": "jitter_dispersion", "has_significant_jitter": true, "jitter_metric": 14.55}
}
🤝 Contributing
Contributions are welcome! Please see the Contributing Guide for the development setup, the checks every change must pass, and the pull request workflow.
- Fork the repository
- Create a feature branch (
git switch -c feat/amazing-feature) - Commit your changes (
git commit -m 'feat: add amazing feature') - Push to the branch (
git push origin feat/amazing-feature) - Open a Pull Request
Project documentation
| Document | Contents |
|---|---|
| CONTRIBUTING.md | Development setup, workflow, PR expectations |
| CHANGELOG.md | Release history |
| AGENTS.md | Guidance for AI coding agents working in this repo |
| SECURITY.md | Vulnerability reporting, and what data this tool handles |
| CODE_OF_CONDUCT.md | Community standards |
| docs/INSTALLATION.md | Installation details and troubleshooting |
| docs/INPUT_FORMATS.md | Input contract: CSV, scamper JSON, DataFrame, InfluxDB |
| docs/ALGORITHM_SELECTION_GUIDE.md | Choosing a change point detector |
| docs/ALGORITHM_USAGE.md | Per-detector options and examples |
| docs/VISUALIZATION_USAGE.md | jitterbug visualize, the five figures, JitterbugPlotter |
| docs/PERFORMANCE.md | Runtime across releases, and where the speedup comes from |
| examples/README.md | Scripts and notebooks |
📄 License
This project is licensed under the MIT License - see the LICENSE file for details.
🔗 Related Resources
- Jitterbug paper (PAM 2022)
- bayesian_changepoint_detection (docs, PyPI
bayesian-changepoint): the Bayesian detector behind thebcpextra. Its 1.2 release made the paper's configuration about 6× faster than Jitterbug 1.0 and more accurate than the version Jitterbug used before; see docs/PERFORMANCE.md - ruptures: the default change point library
- scamper: the measurement tool whose JSON output Jitterbug reads
🙏 Acknowledgments
Jitterbug is the software behind the following paper. If you use it in your research, please cite it (also available as CITATION.cff for GitHub's "Cite this repository" button):
Paper: "Jitterbug: A New Framework for Jitter-Based Congestion Inference" Authors: Esteban Carisimo, Ricky K. P. Mok, David D. Clark, and K. C. Claffy Conference: Passive and Active Measurement (PAM), March 2022 Link: https://doi.org/10.1007/978-3-030-98785-5_7
@InProceedings{carisimo2022jitterbug,
  author    = {Carisimo, Esteban and Mok, Ricky K. P. and Clark, David D. and Claffy, K. C.},
  title     = {Jitterbug: A New Framework for Jitter-Based Congestion Inference},
  booktitle = {Passive and Active Measurement},
  year      = {2022},
  publisher = {Springer International Publishing},
  pages     = {155--179},
  doi       = {10.1007/978-3-030-98785-5_7}
}
Thanks to the authors of ruptures and bayesian_changepoint_detection for the libraries this framework builds on.